Literally it is the Abode of the Clouds, the name Meghalaya describes the climatic phenomenon that brings torrents of rain to its mountainous terrain. No wonder the two most wettest places on earth 'Mawsynram' and 'Cherrapunjee' are found here.
This hilly state has been called 'a patch of beauty and grace' and is famed as 'the Scotland of the East'. It is linked to the Borail Range, an offshoot of the Himalayan Mountains.
The refreshing mountain air, the whispering pines, the exotic flora and fauna, the caves - all stretch out the tourist a tremendous taste of beauty. Here's Nature in all its glory. Limpid lakes, expansive rivers, babbling a stream breaking into waterfalls, twisting and turning, disappearing in the jungle, …this is Meghalaya.
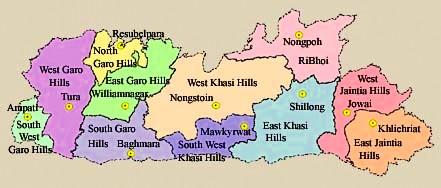
Meghalaya has a total geographical area of 22,429 sq. km. It is the third largest State in the North East in terms of geographical area. The State has vast natural resources of coal, limestone, kaolin, granite etc. The Khasis, the Jaintias and the Garos form the major ethnic groups of original inhabitants of the State.
►POPULATION:
District-wise Distribution of Population, Growth rate, Density, Sex ratio and Literacy rate of Meghalaya, (2011 Census):
| District | Geographical Area (Sq. km.) | Population | Growth Rate (%) | Sex Ratio | Literacy | Density/km |
| East Khasi Hills | 2820 | 825922 | 24.96 | 1011 | 84.15 | 301 |
| West Garo Hills | 3715 | 643291 | 24.09 | 984 | 67.58 | 175 |
| Jaintia Hills | 3819 | 395124 | 32.10 | 1013 | 61.64 | 103 |
| West Khasi Hills | 5247 | 383461 | 29.53 | 980 | 77.87 | 73 |
| East Garo Hills | 2603 | 317917 | 26.87 | 972 | 73.95 | 122 |
| Ri Bhoi | 2376 | 258840 | 34.26 | 953 | 75.67 | 106 |
| South Garo Hills | 1849 | 142334 | 40.95 | 945 | 71.72 | 75 |
| Meghalaya | 22429 | 2966889 | 27.95 | 989 | 74.43 | 132 |
Sources : cesus2011.co.in
►ECONOMY:
Gross State Domestic Product:
(Rupee in Crores) (As on 28-02-2018)
| Year | Current Price | Constant (2011-12) Price |
| 2011-2012 | 19918 | 19918 |
| 2012-2013 | 21872 | 20354 |
| 2013-2014 | 22938 | 20726 |
| 2014-2015 | 23235 | 20158 |
| 2015-2016 | 25967 | 21756 |
| 2016-2017 | 28446 | 23089 |
Source: Central Statistical Organisation
Net State Domestic Product:
(Rupee in Crores) (As on 28-02-2018)
| Year | Current Price | Constant (2011-12) Price |
| 2011-2012 | 18028 | 18028 |
| 2012-2013 | 19653 | 18323 |
| 2013-2014 | 20415 | 18397 |
| 2014-2015 | 20697 | 17911 |
| 2015-2016 | 23328 | 19421 |
| 2016-2017 | 25590 | 20604 |
Source: Central Statistical Organisation
Per Capita Net State Domestic Product:
(Rupees) (As on 28-02-2018)
| Year | Current Price | Constant (2011-12) Price |
| 2011-2012 | 60013 | 60013 |
| 2012-2013 | 64036 | 59703 |
| 2013-2014 | 65118 | 58681 |
| 2014-2015 | 64638 | 55936 |
| 2015-2016 | 71318 | 59373 |
| 2016-2017 | 76594 | 61670 |
Source: Central Statistical Organisation
►AGRICULTURE:
Year-wise Area, Production and Yield of Some Important Agricultural Crops, 2013-14 to 2016-17:
(Area In Hectares, Production in Metric Tonnes and Yield in Kg/Hectare)
| Year | Rice | Wheat | Maize | ||||||
| Area | Production | Yield | Area | Production | Yield | Area | Production | Yield | |
| 1 | 2 | 3 | 4 | 5 | 6 | 7 | 8 | 9 | 10 |
| 2013-2014 | 110033 | 280546 | 2550 | 422 | 789 | 1870 | 18025 | 39655 | 2200 |
| 2014-2015 | 110323 | 297939 | 2701 | 442 | 844 | 1910 | 24407 | 55572 | 2277 |
| 2015-2016 | 110613 | 314379 | 2842 | 464 | 915 | 1972 | 26848 | 62556 | 2330 |
| 2016-2017 | 110891 | 330392 | 2979 | 489 | 1012 | 2070 | 29533 | 71056 | 2406 |
Contd.
| Year | Pulse | Oilseed | Small Millets | ||||||
| Area | Production | Yield | Area | Production | Yield | Area | Production | Yield | |
| 1 | 11 | 12 | 13 | 14 | 15 | 16 | 17 | 18 | 19 |
| 2013-2014 | 7988 | 10981 | 1375 | 15191 | 18050 | 1188 | 2854 | 2538 | 889 |
| 2014-2015 | 8053 | 11306 | 1404 | 15316 | 18528 | 1210 | 2878 | 2649 | 920 |
| 2015-2016 | 8214 | 12108 | 1474 | 15498 | 19663 | 1269 | 2907 | 2857 | 983 |
| 2016-2017 | 8304 | 12687 | 1528 | 15713 | 21123 | 1344 | 2942 | 3058 | 1039 |
Source: Directorate of Agriculture, Meghalaya, Shillong
►SERICULTURE:
Number of Sericultural Farms, Eri Seed Grainage and Silk Reeling Units, 2011-12 to 2014-15:
| Particulars | 2011-12 | 2012-13 | 2013-14 | 2014-15 |
| Sericultural Farms. a. Nos. | 6 | 6 | 6 | 6 |
| b. Area (Hect ) | 130 | 143 | 135 | 70 |
| Eri Seed Grainage a. Nos. | 4 | 7 | 7 | 9 |
| b. Area (Hect ) | 42 | 49 | 71 | 48 |
| Silk Reeling Units a. Nos 1. Mulberry | 4 | 4 | 4 | 4 |
| 2. Muga | 4 | 2 | 2 | 8 |
| b. Quantity of Raw silk produced (Kgs) | - | - | - | - |
| 1. Mulberry | 1252 | 2390 | 14721 | 16782 |
| 2. Eri | 550000 | 364507 | 657290 | 622390 |
| 3. Muga | 3314 | 3918 | 11908 | 16337 |
Source: Statistical Handbook of Meghalaya 2017
►LIVESTOCK AND VETERINARY:
Livestock Population Trend, 1982, 1988, 1992, 1997, 2003, 2007, 2012:
('000 Nos.)
| Categories | 1982 | 1988 | 1992 | 1997 | 2003 | 2007 | 2012 |
| Cattle | 550 | 586 | 637 | 756 | 767 | 887.24 | 905.75 |
| Buffaloes | 29 | 28 | 34 | 17 | 18 | 22.63 | 24.89 |
| Goats | 186 | 195 | 196 | 280 | 327 | 21.04 | 20.99 |
| Sheep | 26 | 15 | 23 | 17 | 18 | 365.48 | 472.33 |
| Horses and Ponies | 8 | 5 | 3 | 2 | 2 | 2.70 | 1.30 |
| Pig | 206 | 280 | 294 | 351 | 420 | 524.36 | 569.30 |
| Other Livestock | 12 | - | - | - | - | - | - |
| Total Livestock | 1017 | 1109 | 1187 | 1423 | 1552 | 1824.03 | 1994.56 |
| Total Poultry | 1419 | 1591 | 1826 | 2152 | 2821 | 3092.87 | 3564.56 |
Source: Statistical Abstract Meghalaya, 2016
►FISHERY:
Fish seed Distribution, 2010-11 to 2015-16:
(In '000 nos.)
| 2010-11 | 2011-12 | 2012-13 | 2013-14 | 2014-15 | 2015-16 |
| 6593.9 | 4028.6 | 4740.8 | 4122 | 5080 | 5098 |
Source : Statistical Handbook Meghalaya 2014 and 2017
Fish Seed Farm, Production Fry Fingerlings and Fish Production in Meghalaya, 2010-11 to 2015-16:
| Year | Fish Seed Farm (Nos.) | Fry Fingerlings (Million) | Inland Fish Production both Captured & Cultured Fisheries |
| 2010-2011 | 14 | 2.9 | 4.5 |
| 2011-2012 | 14 | 0.9 | 4.8 |
| 2012-2013 | 14 | 0.7 | 5.4 |
| 2013-2014 | 14 | 1.0 | 5.7 |
| 2014-2015 | 15 | 0.7 | 6.0 |
| 2015-2016 | 15 | 0.8 | 11.3 |
Source : Statistical Handbook Meghalaya 2017
►FORESTRY:
Forest Cover:
(Area in Km.2)
| Geographical Area | 2017 Assessment | Percentage of Geographical Area | |||
| Very Dense Forest | Mod Dense Forest | Open Forest | Total | ||
| 22429 | 453 | 9386 | 7307 | 17146 | 76.45 |
| Geographical Area | 2015 Assessment | Percentage of Geographical Area | |||
| Very Dense Forest | Mod Dense Forest | Open Forest | Total | ||
| 22429 | 449 | 9584 | 7184 | 17217 | 77.08 |
| Geographical Area | 2013 Assessment | Percentage of Geographical Area | |||
| Very Dense Forest | Mod Dense Forest | Open Forest | Total | ||
| 22429 | 449 | 9689 | 7150 | 17288 | 77.08 |
| Geographical Area | 2011 Assessment | Percentage of Geographical Area | |||
| Very Dense Forest | Mod Dense Forest | Open Forest | Total | ||
| 22429 | 433 | 9775 | 7067 | 17275 | 77.02 |
Source: India State of Forest Report 2011, 2013, 2015 and 2017
Area under Forest in Meghalaya, 2000-01 to 2013-14:
('000 Hectares)
| Year | Total |
| 2000-2001 | 949.56 |
| 2001-2002 | 949.56 |
| 2002-2003 | 949.56 |
| 2003-2004 | 949.56 |
| 2004-2005 | 963.03 |
| 2005-2006 | 963.03 |
| 2006-2007 | 963.03 |
| 2007-2008 | 963.03 |
| 2008-2009 | 963.03 |
| 2009-2010 | 963.03 |
| 2010-2011 | 963.03 |
| 2011-2012 | 963.03 |
| 2012-2013 | 963.03 |
| 2013-2014 | 963.03 |
Source: Statistical Handbook Meghalaya 2014 and 2017
►INDUSTRY:
Number of Small Scale Industrial Units registered with the Directorate of Industries, 1996-97 to 2014-15:
| Year | No. of S.S.I. | Investment in Plant & Machinery (Rs. in Lakhs) | No. of Persons employed |
| 1996-1997 | 2765 | 1991.45 | 16104 |
| 1997-1998 | 3008 | 2249.50 | 17259 |
| 1998-1999 | 3270 | 2467.87 | 18585 |
| 1999-2000 | 3530 | 2952.49 | 20086 |
| 2000-2001 | 3803 | 3249.49 | 21416 |
| 2001-2002 | 4070 | 5211.18 | 23052 |
| 2002-2003 | 4341 | 4275.81 | 24332 |
| 2003-2004 | 4664 | 5892.03 | 26237 |
| 2004-2005 | 5132 | 6613.80 | 28894 |
| 2005-2006 | 5591 | 7974.95 | 31469 |
| 2006-2007 | 6107 | 9034.14 | 34158 |
| 2007-2008 | 6511 | 10282.71 | 36193 |
| 2008-2009 | 6842 | 12175.10 | 37656 |
| 2009-2010 | 1040 | 3453.95 | 4199 |
| 2010-2011 | 748 | 1921.43 | 3236 |
| 2011-2012 | 573 | 2102.82 | 2434 |
| 2012-2013 | 641 | 3585.65 | 3057 |
| 2013-2014 | 629 | 4141.31 | 2401 |
| 2014-2015 | 506 | 5143.63 | 2059 |
Source: Statistical Abstract Meghalaya, 2016
Statistical Handbook of Meghalaya 2017
►EDUCATION:
Literacy Rate of Meghalaya, Census 2011:
| Particulars | Total | Male | Female |
| Rural | 69.92 | 71.46 | 67.15 |
| Urban | 90.79 | 92.46 | 89.24 |
| Meghalaya | 74.43 | 75.95 | 72.89 |
Source: census2011.co.in
Number of Educational Institutions by type of Institutions in Meghalaya, 2012-13 to 2014-15:
| Type of Schools | 2012-13 | 2013-14 | 2014-15 |
| Primary Only | 9164 | 9260 | 9323 |
| Primary with Upper Primary | 137 | 133 | 152 |
| Primary with Upper Primary and Secondary/ Higher Secondary | 21 | 26 | 23 |
| Upper Primary Only | 3317 | 3251 | 3388 |
| Upper Primary with Secondary Higher Secondary | 52 | 80 | 48 |
| Primary with Upper Primary and Secondary | 71 | 86 | 95 |
| Upper Primary with Secondary | 116 | 209 | 146 |
| Total | 12878 | 13045 | 13175 |
| Vocational/ Professional/ Special and other Education | NA | NA | NA |
| Colleges | 71 | 71 | 71 |
| University | 11 | 11 | 11 |
NA: Information Not Available
Source: Statistical Abstract Meghalaya, 2016
Statistical Handbook of Meghalaya 2017
►POWER & ELECTRICITY:
Generation of Electricity, 2007-08 to 2014-15:
| Year | Generation (MKwh) |
| 2007-08 | 665.38 |
| 2008-09 | 554.13 |
| 2009-10 | 536.15 |
| 2010-11 | 509.17 |
| 2011-12 | 518.50 |
| 2012-13 | 705.93 |
| 2013-14 | 868.56 |
| 2014-15 | 842.63 |
Source: Statistical Handbook of Meghalaya 2017
No. of Villages Electrified, 2008-09 to 2014-15:
| Year | Villages Electrified (Nos.) | Percentage of Villages Electrified |
| 2008-09 | 3748 | 64.82 |
| 2009-10 | 3806 | 65.82 |
| 2010-11 | 3850 | 66.59 |
| 2011-12 | 4865 | 84.14 |
| 2012-13 | 5330 | 92.18 |
| 2013-14 | 5666 | 87.71 |
| 2014-15 | 5702 | 88.28 |
Source: Statistical Handbook of Meghalaya 2017
►ROAD TRANSPORT:
Number of Registered Vehicles in Meghalaya, 2014-15 and 2015-16:
| 2014-2015 | 2015-2016 | Difference of total 2014-15 & 2015-16 (in Nos.) | ||||||
| Govt. | Pvt. | Total | Govt. | Pvt. | Total | Govt. | Pvt. | Total |
| 8805 | 248138 | 256943 | 9195 | 268826 | 278021 | 390 | 20688 | 21078 |
Source: Statistical Handbook of Meghalaya 2017
Number of Motor Vehicles Registered in Meghalaya, 2015-16:
| Type of Vehicles | Trucks | Buses | Cars | Jeeps | Tractors | Trailers | Two Wheelers | Three Wheelers | Taxis (Local + Tourist) | Maxi Taxis | Others | Total |
| Govt. | 1777 | 736 | 1045 | 3901 | 174 | 316 | 656 | - | - | 5 | 585 | 9195 |
| Pvt. | 28068 | 4809 | 73962 | 17495 | 691 | 2557 | 94494 | 12970 | 18432 | 4706 | 10642 | 268824 |
| Total | 29845 | 5545 | 75007 | 21396 | 865 | 2873 | 95150 | 12970 | 18432 | 4711 | 112215 | 278019 |
Source: Statistical Handbook of Meghalaya 2017
►POSTAL SERVICE:
Statistics of Post Offices, 2014-15 and 2015-16:
(in Nos.)
| Items | 2014-2015 | 2015-2016 |
| General Post Office | 1 | 1 |
| Head Post Office | 1 | 1 |
| Sub-Post Office | 65 | 66 |
| Branch Post Office | 425 | 423 |
| Letter Boxes | 669 | 669 |
Source: Statistical Handbook of Meghalaya 2017
►HEALTH:
Number of Primary Health Centres, Community Health Centres, Sub-Centres, (Including M.C.W. Centres Etc.) Leprosy Colonies, Leprosy Control Unit & Survey & Education Treatment Centres, 2011-12 to 2015-16:
| Year | Primary Health Centre | Community Health Centre | Sub Centre (including functional MCW) | Leprosy Colonies | Leprosy Control Unit | Set Centre |
| 2011-2012 | 109 | 29 | 417 | 1 | 2 | 31 |
| 2012-2013 | 110 | 30 | 422 | 1 | 2 | 31 |
| 2013-2014 | 110 | - | 422 | 1 | 2 | 27 |
| 2014-2015 | 110 | 28 | 422 | 1 | 2 | 27 |
| 2015-2016 | 110 | 28 | 423 | 1 | 2 | 27 |
Source: Statistical Handbook of Meghalaya 2017
►CO-OPERATVE:
Growth of Co-operative Societies, 2001-02 to 2014-15:
| Year | No. of Societies | Membership ('000 Nos.) | Share Capital (Rs. in Lakhs.) | Working Capital (Rs. in Lakhs) |
| 2001-02 | 1000 | 165 | 3029.87 | 31733.51 |
| 2002-03 | 1018 | 150 | 4674.53 | 56790.97 |
| 2003-04 | 1042 | 150 | 49407.97 | 4610.30 |
| 2004-05 | 1118 | 151 | 954.82 | 5660.27 |
| 2005-06 | 1153 | 167 | 3943.92 | 56667.77 |
| 2006-07 | 1192 | 178 | 14932.57 | 15838.37 |
| 2007-08 | 1239 | 181 | 23761.31 | 20748.50 |
| 2008-09 | 1319 | 179 | 4925.18 | 117232.43 |
| 2009-10 | 1339 | 178 | 5372.18 | 119649.89 |
| 2010-11 | 1391 | 186 | 6405.37 | 217800.78 |
| 2011-12 | 1391 | 171 | 6975.75 | 177352.08 |
| 2012-13 | 1402 | 172 | 8037.38 | 204919.76 |
| 2013-14 | 1410 | 172 | 8971.26 | 209865.25 |
| 2014-15 | 1460 | 174 | 9132.19 | 227811.43 |
Source: Statistical Abstract Meghalaya, 2016
Statistical Handbook of Meghalaya 2017
►BANKING:
Bank-wise and population Group-wise Number of Functioning Offices of Commercial Banks, 2014 to 2017:
(As on December)
| Bank | 2014 | 2015 | 2016 | 2017 | ||||||||||||
| Rural | Semi-Urban | Urban | Total | Rural | Semi-Urban | Urban | Total | Rural | Semi-Urban | Urban | Total | Rural | Semi-Urban | Urban | Total | |
| State Bank Of India | 69 | 16 | 20 | 105 | 70 | 16 | 20 | 106 | 71 | 16 | 22 | 109 | 71 | 16 | 22 | 109 |
| Allahabad Bank | 1 | - | 1 | 2 | 1 | - | 1 | 2 | 1 | - | 1 | 2 | 1 | - | 1 | 2 |
| Andhra Bank | - | - | 1 | 1 | - | - | 1 | 1 | - | - | 1 | 1 | - | - | 1 | 1 |
| Bank Of Baroda | 1 | 1 | 3 | 5 | 1 | 1 | 3 | 5 | 1 | 1 | 3 | 5 | 1 | 1 | 3 | 5 |
| Bank Of India | - | 1 | 3 | 4 | - | 1 | 3 | 4 | - | 1 | 3 | 4 | - | 1 | 3 | 4 |
| Bank Of Maharashtra | - | - | 1 | 1 | - | - | 1 | 1 | - | - | 1 | 1 | - | - | 1 | 1 |
| Canara Bank | 3 | 3 | 4 | 10 | 3 | 3 | 4 | 10 | 3 | 3 | 4 | 10 | 3 | 3 | 4 | 10 |
| Central Bank Of India | - | 4 | 6 | 10 | - | 4 | 6 | 10 | - | 4 | 6 | 10 | - | 4 | 6 | 10 |
| Corporation Bank | - | 1 | 1 | 2 | - | 1 | 1 | 2 | - | 1 | 2 | 3 | - | 1 | 2 | 3 |
| Dena Bank | - | - | 1 | 1 | - | - | 1 | 1 | - | - | 1 | 1 | - | - | 1 | 1 |
| Indian Bank | 1 | - | 1 | 2 | 1 | - | 1 | 2 | 1 | - | 2 | 3 | 1 | - | 2 | 3 |
| Indian Overseas Bank | - | 1 | 1 | 2 | - | 1 | 2 | 3 | - | 1 | 2 | 3 | - | 1 | 2 | 3 |
| Oriental Bank of Commerce | - | - | 1 | 1 | - | - | 1 | 1 | - | - | 1 | 1 | - | - | 1 | 1 |
| Punjab And Sind Bank | - | - | 1 | 1 | - | - | 1 | 1 | - | - | 1 | 1 | - | - | 1 | 1 |
| Punjab National Bank | 6 | 1 | 3 | 10 | 6 | 2 | 3 | 11 | 6 | 3 | 3 | 12 | 6 | 3 | 4 | 13 |
| Syndicate Bank | 2 | 1 | 2 | 5 | 2 | 1 | 2 | 5 | 2 | 1 | 2 | 5 | 2 | 1 | 2 | 5 |
| Uco Bank | 3 | 3 | 2 | 8 | 3 | 3 | 2 | 8 | 3 | 3 | 2 | 8 | 3 | 3 | 2 | 8 |
| Union Bank Of India | 2 | 2 | 1 | 5 | 2 | 2 | 1 | 5 | 2 | 2 | 1 | 5 | 2 | 2 | 1 | 5 |
| United Bank Of India | 8 | 4 | 4 | 16 | 8 | 4 | 4 | 16 | 8 | 4 | 4 | 16 | 8 | 4 | 4 | 16 |
| Vijaya Bank | - | 1 | 3 | 4 | - | 1 | 3 | 4 | - | 1 | 3 | 4 | - | 1 | 3 | 4 |
| Bharatiya Mahila Bank Ltd. | - | - | 1 | 1 | - | - | 1 | 1 | - | - | 1 | 1 | - | - | - | - |
| IDBI Bank Limited | - | 1 | 1 | 2 | - | 1 | 1 | 2 | - | 1 | 1 | 2 | - | 1 | 1 | 2 |
| Megalaya Rural Bank | 57 | 18 | 18 | 93 | 58 | 18 | 18 | 94 | 59 | 18 | 18 | 95 | 60 | 18 | 18 | 96 |
| Axis Bank Limited | 1 | 3 | 2 | 6 | 1 | 3 | 2 | 6 | 1 | 3 | 4 | 8 | 1 | 3 | 5 | 9 |
| Bandhan Bank Limited | - | - | - | - | 1 | 2 | 5 | 8 | 1 | 2 | 5 | 8 | 1 | 2 | 5 | 8 |
| Federal Bank Ltd | - | - | 2 | 2 | - | - | 2 | 2 | - | - | 2 | 2 | - | - | 2 | 2 |
| HDFC Bank Ltd. | 5 | 6 | 3 | 14 | 5 | 8 | 4 | 17 | 5 | 8 | 4 | 17 | 6 | 8 | 4 | 18 |
| ICICI Bank Limited | 2 | 3 | 2 | 7 | 4 | 3 | 3 | 10 | 4 | 3 | 3 | 10 | 4 | 3 | 3 | 10 |
| IDFC Bank Limited | - | - | - | - | - | - | - | - | - | - | 1 | 1 | - | - | 1 | 1 |
| Indusind Bank Ltd | - | - | 1 | 1 | - | 1 | 1 | 2 | - | 1 | 1 | 2 | - | 3 | 1 | 4 |
| Kotak Mahindra Bank Ltd. | - | - | 1 | 1 | - | - | 1 | 1 | - | - | 1 | 1 | - | - | 1 | 1 |
| South Indian Bank Ltd | - | - | 1 | 1 | - | - | 1 | 1 | - | - | 1 | 1 | - | - | 1 | 1 |
| Yes Bank Ltd. | - | - | 1 | 1 | - | - | 1 | 1 | - | - | 1 | 1 | - | - | 1 | 1 |
| North East Small Finance Bank Limited | - | - | - | - | - | - | - | - | - | - | - | - | 2 | - | 1 | 3 |
| Meghalaya Total | 161 | 70 | 93 | 324 | 166 | 76 | 101 | 343 | 168 | 77 | 108 | 353 | 172 | 79 | 110 | 361 |
Source: Reserve Bank of India