Estimates of Area of Wheat (Rabi), 2017-18 to 2021-22:
| State | Area ('000 Hectares) | ||||
| 2017-18 | 2018-19 | 2019-20 | 2020-21 | 2021-22 | |
| Assam | 17.79 | 16.95 | 11.34 | 9.34 | 9.12 |
| All India | 29650.59 | 29318.79 | 31357.02 | 31125.16 | 30458.53 |
Source: Ministry of Agriculture and Farmers Welfare, Govt. of India
State-wise Estimates of Area of Wheat, 2015-16 to 2019-20:
| State | Area ('000 Hectares) | ||||
| 2015-16 | 2016-17 | 2017-18 | 2018-19 | 2019-20 | |
| Assam | 20.98 | 17.45 | 17.79 | 16.95 | 11.34 |
| All India | 30417.80 | 30785.23 | 29650.59 | 29318.78 | 31357.02 |
Source: Ministry of Agriculture and Farmers Welfare, Govt. of India
Estimates of Production of Wheat (Rabi), 2017-18 to 2021-22:
| State | Production ('000 Tonnes) | ||||
| 2017-18 | 2018-19 | 2019-20 | 2020-21 | 2021-22 | |
| Assam | 24.65 | 23.69 | 14.43 | 12.88 | 11.38 |
| All India | 99869.52 | 103596.23 | 107860.51 | 109586.50 | 107742.07 |
Source: Ministry of Agriculture and Farmers Welfare, Govt. of India
State-wise Estimates of Production of Wheat, 2015-16 to 2019-20:
| State | Production ('000 Tonnes) | ||||
| 2015-16 | 2016-17 | 2017-18 | 2018-19 | 2019-20 | |
| Assam | 34.26 | 23.45 | 24.65 | 23.69 | 14.43 |
| All India | 92287.53 | 98510.22 | 99869.52 | 103596.23 | 107860.51 |
Source: Ministry of Agriculture and Farmers Welfare, Govt. of India
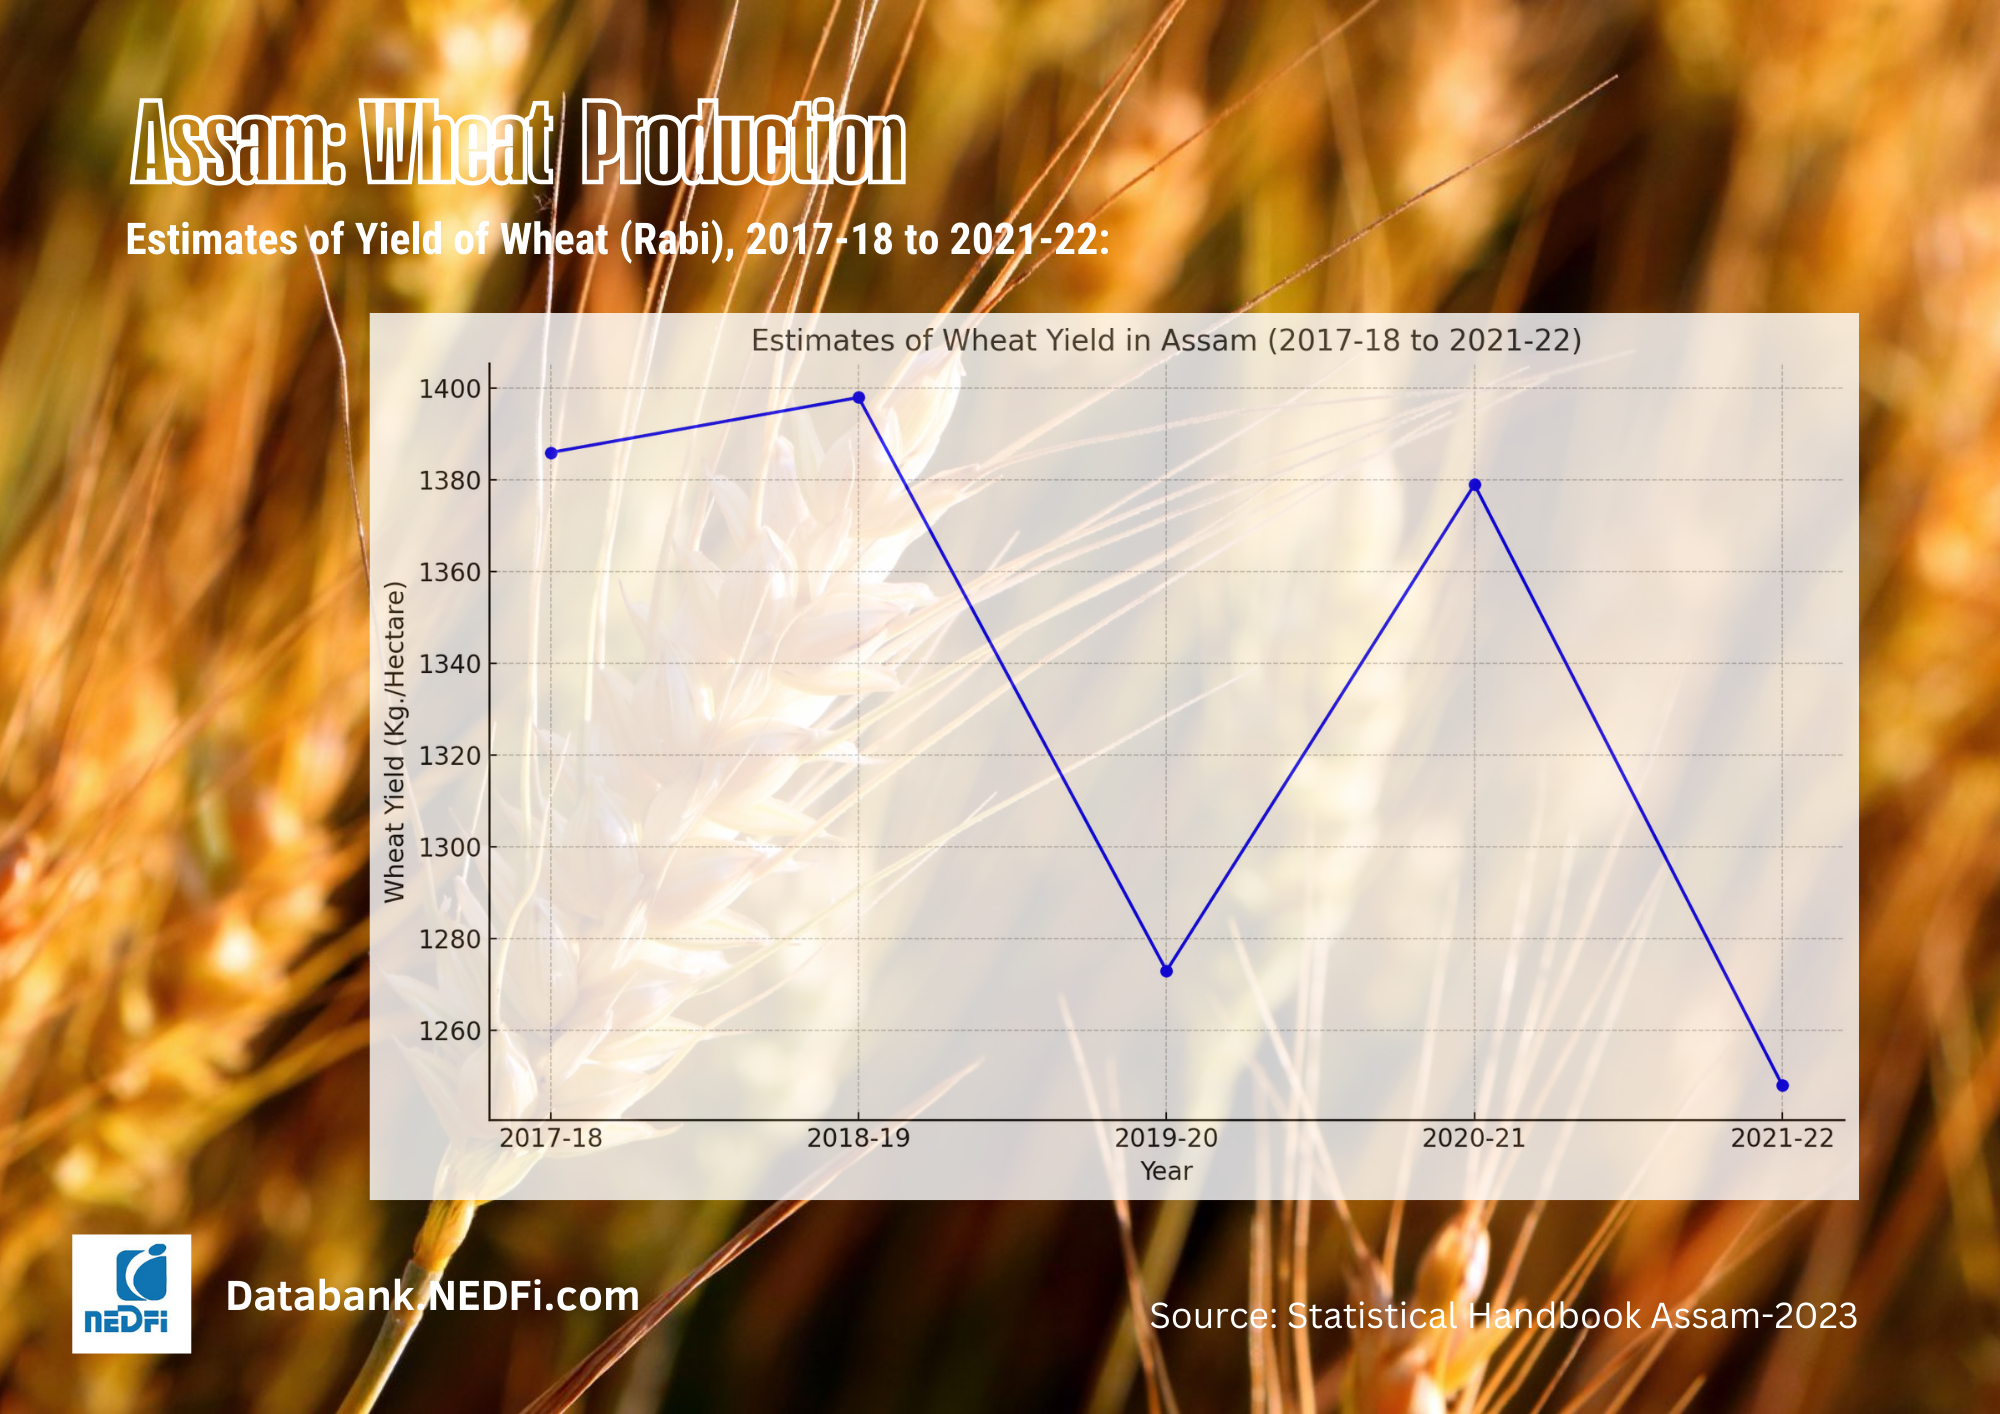
Estimates of Yield of Wheat (Rabi), 2017-18 to 2021-22:
| State | Yield (Kg./Hectare) | ||||
| 2017-18 | 2018-19 | 2019-20 | 2020-21 | 2021-22 | |
| Assam | 1386 | 1398 | 1273 | 1379 | 1248 |
| All India | 3368 | 3533 | 3440 | 3521 | 3537 |
Source: Ministry of Agriculture and Farmers Welfare, Govt. of India
State-wise Estimates of Yield of Wheat, 2015-16 to 2019-20:
| State | Yield (Kg./Hectare) | ||||
| 2015-16 | 2016-17 | 2017-18 | 2018-19 | 2019-20 | |
| Assam | 1634 | 1344 | 1386 | 1398 | 1273 |
| All India | 3034 | 3200 | 3368 | 3533 | 3440 |
Source: Ministry of Agriculture and Farmers Welfare, Govt. of India
District-wise Area, Production and Yield of Wheat, 2021-22:
| District | Area (Hectare) | Production (Tonnes) | Yield (Tonnes/Hectare) |
| Baksa | 210 | 361 | 1.72 |
| Barpeta | 1,526.00 | 2,142.00 | 1.4 |
| Biswanath | 38 | 48 | 1.26 |
| Bongaigaon | 479 | 422 | 0.88 |
| Cachar | 42 | 53 | 1.26 |
| Chirang | 325 | 495 | 1.52 |
| Darrang | 34 | 41 | 1.21 |
| Dhemaji | 47 | 59 | 1.26 |
| Dhubri | 375 | 617 | 1.65 |
| Dibrugarh | 55 | 69 | 1.25 |
| Goalpara | 727 | 1,034.00 | 1.42 |
| Golaghat | 77 | 96 | 1.25 |
| Hojai | 415 | 518 | 1.25 |
| Jorhat | 1 | 1 | 1 |
| Kamrup | 306 | 387 | 1.26 |
| Kamrup metro | 2 | 2 | 1 |
| Karbi anglong | 722 | 1,038.00 | 1.44 |
| Karimganj | 3 | 4 | 1.33 |
| Kokrajhar | 287 | 403 | 1.4 |
| Lakhimpur | 50 | 62 | 1.24 |
| Majuli | 2 | 2 | 1 |
| Marigaon | 1,220.00 | 1,068.00 | 0.88 |
| Nagaon | 383 | 387 | 1.01 |
| Nalbari | 238 | 327 | 1.37 |
| Sivasagar | 1 | 1 | 1 |
| Sonitpur | 291 | 311 | 1.07 |
| South salmara mancachar | 510 | 703 | 1.38 |
| Tinsukia | 276 | 345 | 1.25 |
| Udalguri | 75 | 103 | 1.37 |
| West karbi anglong | 400 | 275 | 0.69 |
| Assam | 9117 | 11374 | 1.25 |
Source: Ministry of Agriculture and Farmers Welfare, Govt. of India
District-wise Area, Production and Yield of Wheat, 2018-19:
| District | Area (Hectare) | Production (Tonnes) | Yield (Tonnes/Hectare) |
| Baksa | 280 | 599 | 2.14 |
| Barpeta | 5108 | 7413 | 1.45 |
| Bongaigaon | 627 | 798 | 1.27 |
| Cachar | 44 | 62 | 1.41 |
| Chirang | 558 | 949 | 1.70 |
| Darrang | 226 | 382 | 1.69 |
| Dhemaji | 2 | 2 | 1.00 |
| Dhubri | 2430 | 3629 | 1.49 |
| Goalpara | 1208 | 1655 | 1.37 |
| Golaghat | 122 | 171 | 1.40 |
| Jorhat | 5 | 7 | 1.40 |
| Kamrup | 367 | 390 | 1.06 |
| Kamrup Metro | 5 | 7 | 1.40 |
| Karbi Anglong | 1179 | 1464 | 1.24 |
| Karimganj | 5 | 7 | 1.40 |
| Kokrajhar | 757 | 1048 | 1.38 |
| Lakhimpur | 8 | 11 | 1.38 |
| Morigaon | 1549 | 2269 | 1.46 |
| Nagaon | 1249 | 1281 | 1.03 |
| Nalbari | 197 | 211 | 1.07 |
| Sivasagar | 4 | 5 | 1.25 |
| Sonitpur | 353 | 389 | 1.10 |
| Tinsukia | 15 | 21 | 1.40 |
| Udalguri | 647 | 923 | 1.43 |
| Total - Wheat | 16945.00 | 23693 | 1.40 |
Source: Ministry of Agriculture & Farmers Welfare, Govt. of India
District-wise Area, Production and Yield of Wheat, 2017-18:
| District | Area (Hectare) | Production (Tonnes) | Yield (Tonnes/Hectare) |
| Baksa | 280 | 508 | 1.81 |
| Barpeta | 4835 | 7322 | 1.51 |
| Bongaigaon | 627 | 893 | 1.42 |
| Cachar | 49 | 68 | 1.39 |
| Chirang | 504 | 680 | 1.35 |
| Darrang | 286 | 281 | 0.98 |
| Dhemaji | 1 | 1 | 1 |
| Dhubri | 2753 | 3815 | 1.39 |
| Dibrugarh | 2 | 3 | 1.5 |
| Goalpara | 1213 | 1753 | 1.45 |
| Golaghat | 127 | 176 | 1.39 |
| Jorhat | 4 | 6 | 1.5 |
| Kamrup | 636 | 830 | 1.31 |
| Kamrup Metro | 5 | 7 | 1.4 |
| Karbi Anglong | 1172 | 1624 | 1.39 |
| Karimganj | 5 | 7 | 1.4 |
| Kokrajhar | 838 | 1452 | 1.73 |
| Lakhimpur | 4 | 5 | 1.25 |
| Morigaon | 1931 | 2617 | 1.36 |
| Nagaon | 1448 | 1509 | 1.04 |
| Nalbari | 146 | 117 | 0.8 |
| Sivasagar | 4 | 6 | 1.5 |
| Sonitpur | 342 | 410 | 1.2 |
| Tinsukia | 12 | 17 | 1.42 |
| Udalguri | 562 | 551 | 0.98 |
| Assam | 17786 | 24658 | 1.39 |
Source: Department of Agriculture, Co-operation and Farmers Welfare, Govt. of India