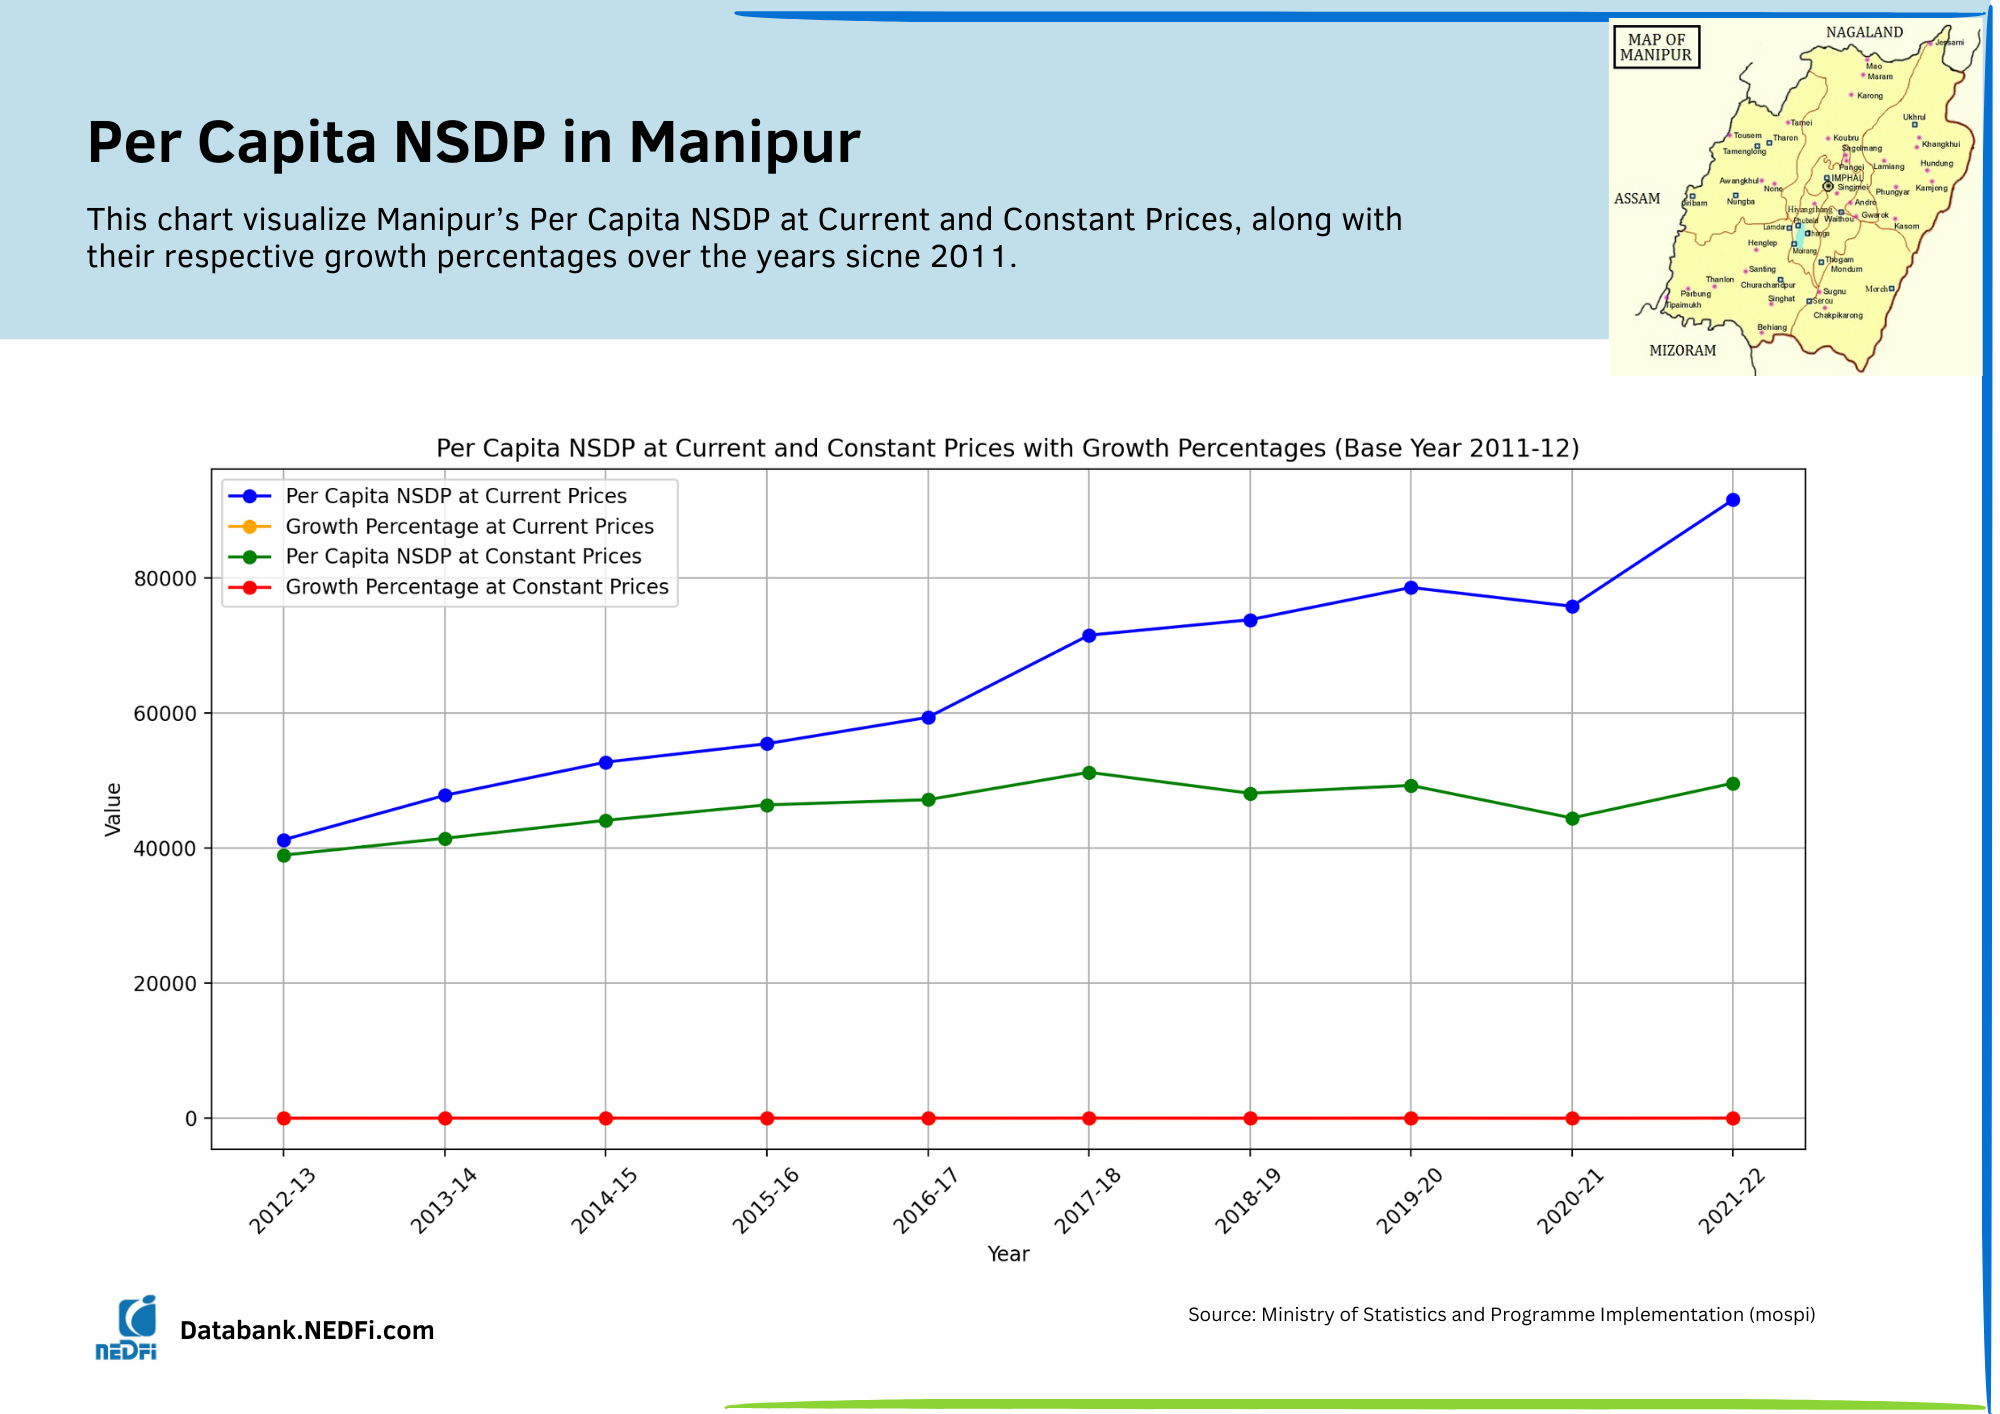
PER CAPITA NSDP : BASE YEAR 2011-12
Per Capita Net State Domestic Product at Current Prices and Percentage of Growth over previous year of
Manipur: (As on 01-08-2024)
| Year | PC NSDP - Current Prices (in Rupees) | % Growth over previous year |
| 2011-2012 | 39762 | - |
| 2012-2013 | 41230 | 3.69 |
| 2013-2014 | 47798 | 15.93 |
| 2014-2015 | 52717 | 10.29 |
| 2015-2016 | 55447 | 5.18 |
| 2016-2017 | 59345 | 7.03 |
| 2017-2018 | 71507 | 20.49 |
| 2018-2019 | 73795 | 3.2 |
| 2019-2020 | 78574 | 6.48 |
| 2020-2021 | 75784 | -3.55 |
| 2021-2022 | 98826 | 30.40 |
| 2022-2023 | 111853 | 13.18 |
| 2023-2024 | NA | NA |
Source: Ministry of Statistics and Programme Implementation (mospi)
Per Capita Net State Domestic Product at Constant (2011-12) Prices and Percentage of Growth over previous
year of Manipur: (As on 01-08-2024)
| Year | PC NSDP - Constant Prices (in Rupees) | % Growth over previous year |
| 2011-2012 | 39762 | - |
| 2012-2013 | 38954 | -2.03 |
| 2013-2014 | 41441 | 6.39 |
| 2014-2015 | 44101 | 6.42 |
| 2015-2016 | 46389 | 5.19 |
| 2016-2017 | 47151 | 1.64 |
| 2017-2018 | 51211 | 8.61 |
| 2018-2019 | 48106 | -6.06 |
| 2019-2020 | 49267 | 2.41 |
| 2020-2021 | 44449 | -9.78 |
| 2021-2022 | 54587 | 22.81 |
| 2022-2023 | 60204 | 10.29 |
| 2023-2024 | NA | NA |
Source: Ministry of Statistics and Programme Implementation (mospi)
![]() Per Capita Net State Domestic Product at Current and Constant (2004-2005) Prices:
Per Capita Net State Domestic Product at Current and Constant (2004-2005) Prices: ![]()
![]() Per Capita Net State Domestic Product at Current and Constant (1999-2000) Prices:
Per Capita Net State Domestic Product at Current and Constant (1999-2000) Prices: ![]()
![]() Per Capita Net State Domestic Product at Current and Constant (1993-1994) Prices:
Per Capita Net State Domestic Product at Current and Constant (1993-1994) Prices: ![]()
![]() Per Capita Net State Domestic Product at Current and Constant (1980-1981) Prices:
Per Capita Net State Domestic Product at Current and Constant (1980-1981) Prices: ![]()