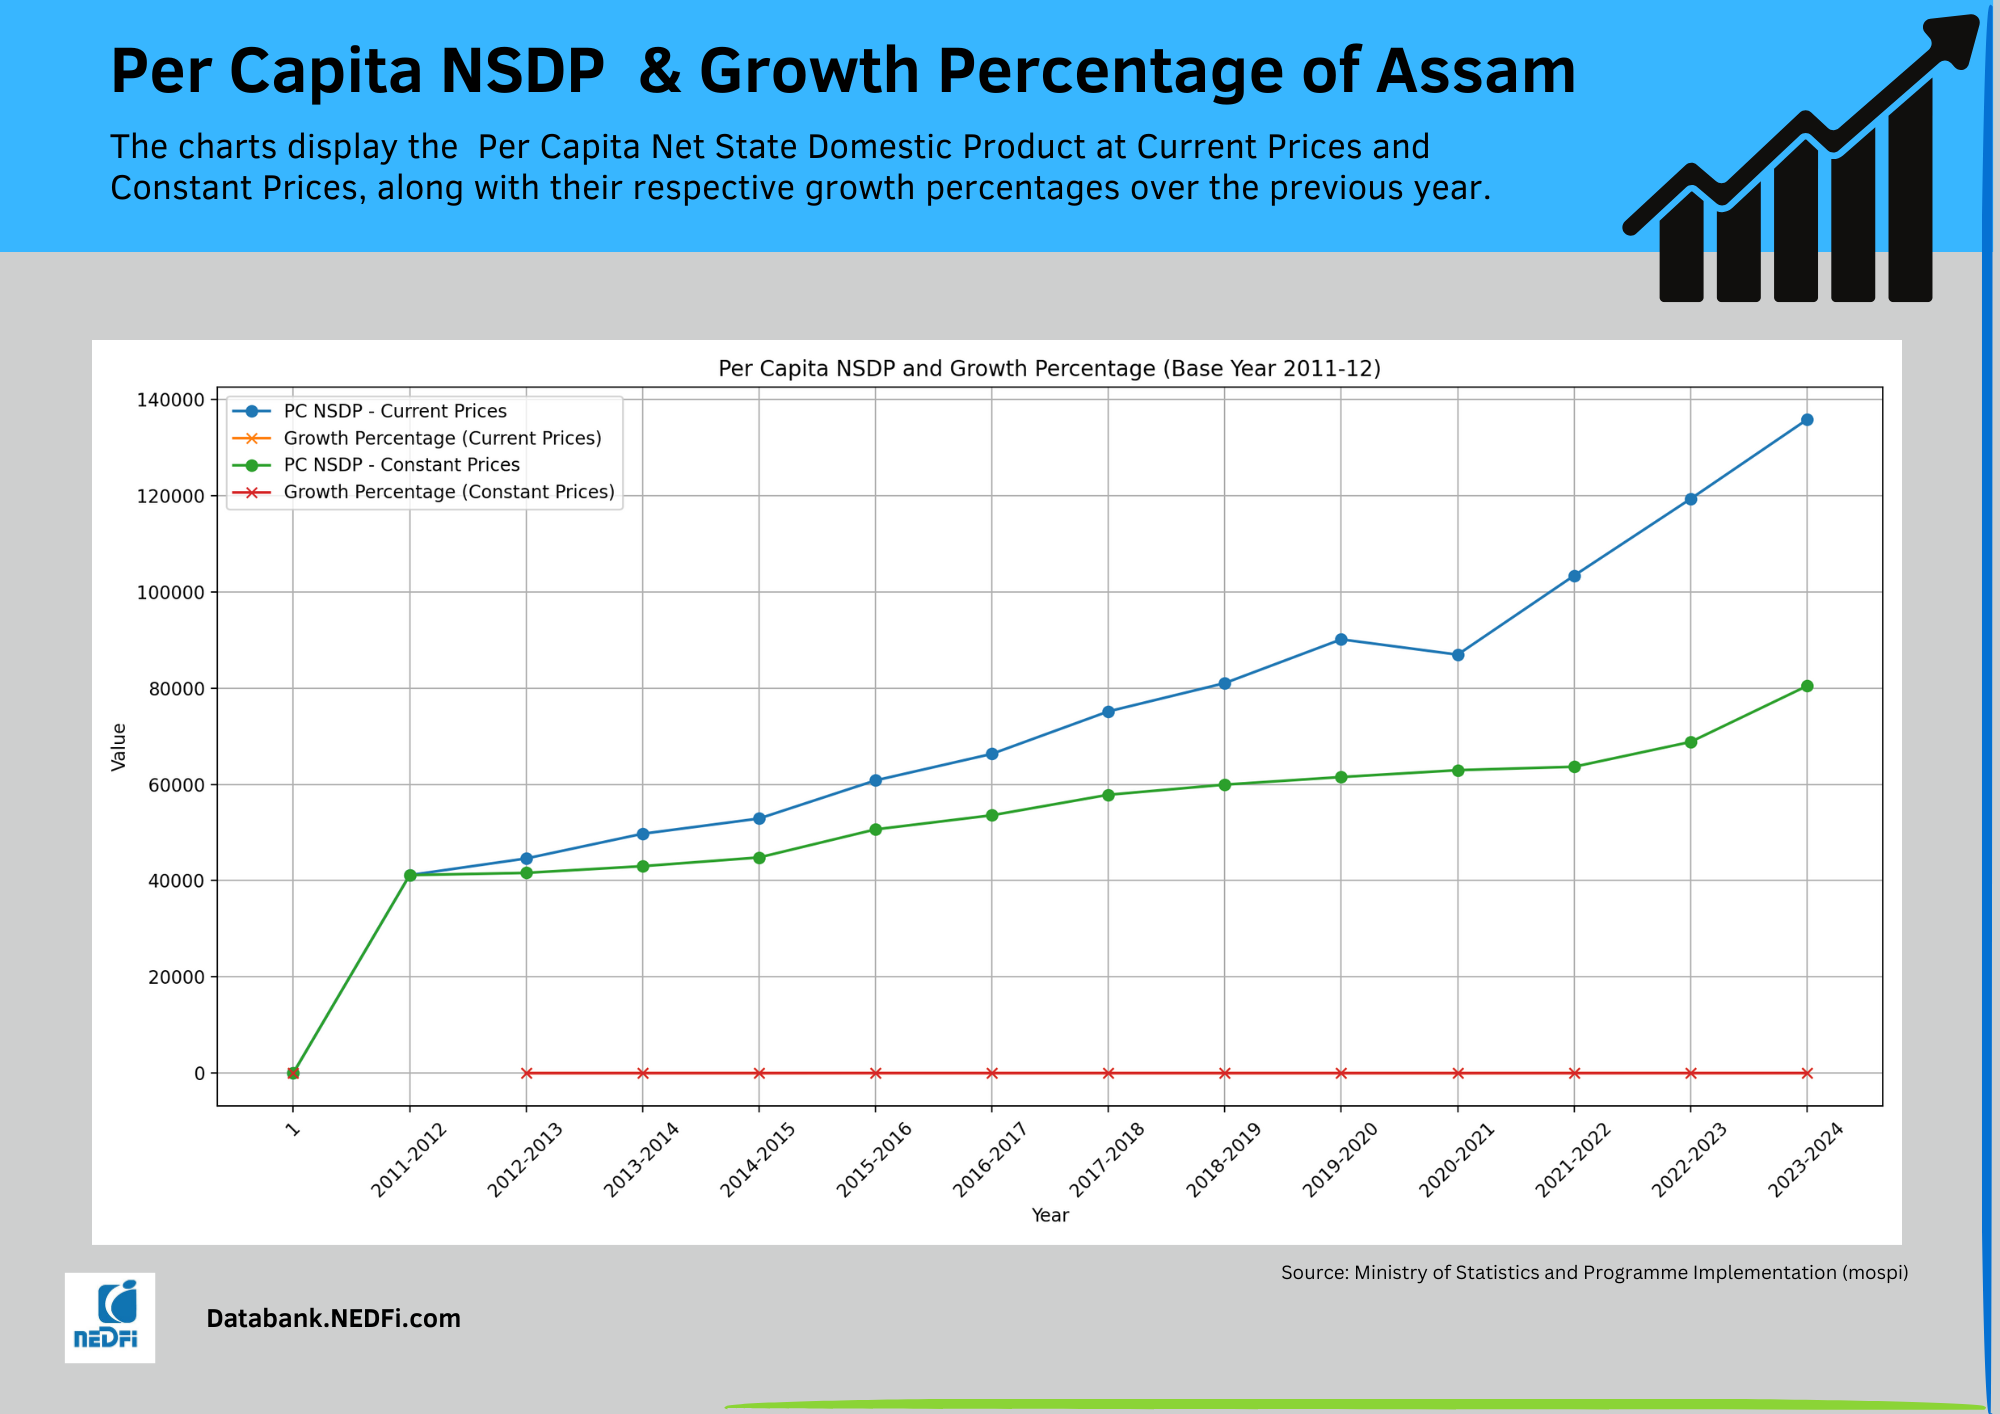
PER CAPITA NSDP : BASE YEAR 2011-12
Per Capita Net State Domestic Product at Current Prices and Percentage of Growth over previous year:
(As on 01-08-2024)
| Year | PC NSDP - Current Prices (in Rupees) | % Growth over previous year |
| 2011-2012 | 41142 | - |
| 2012-2013 | 44599 | 8.40 |
| 2013-2014 | 49734 | 11.51 |
| 2014-2015 | 52895 | 6.36 |
| 2015-2016 | 60817 | 14.98 |
| 2016-2017 | 66330 | 9.07 |
| 2017-2018 | 75151 | 13.30 |
| 2018-2019 | 81034 | 7.83 |
| 2019-2020 | 90123 | 11.22 |
| 2020-2021 | 86947 | -3.52 |
| 2021-2022 | 103371 | 18.89 |
| 2022-2023 | 119308 | 15.42 |
| 2023-2024 | 135787 | 13.81 |
Source: Ministry of Statistics and Programme Implementation (mospi)
Per Capita Net State Domestic Product at Constant (2011-12) Prices and Percentage of Growth over previous year:
(As on 01-08-2024)
| Year | PC NSDP - Constant Prices (in Rupees) | % Growth over previous year |
| 2011-2012 | 41142 | - |
| 2012-2013 | 41609 | 1.14 |
| 2013-2014 | 43002 | 3.35 |
| 2014-2015 | 44809 | 4.20 |
| 2015-2016 | 50642 | 13.02 |
| 2016-2017 | 53575 | 5.79 |
| 2017-2018 | 57835 | 7.95 |
| 2018-2019 | 59943 | 3.64 |
| 2019-2020 | 61519 | 2.63 |
| 2020-2021 | 62944 | 2.32 |
| 2021-2022 | 63657 | 1.13 |
| 2022-2023 | 68813 | 8.10 |
| 2023-2024 | 80440 | 16.90 |
Source: Ministry of Statistics and Programme Implementation (mospi)