PER CAPITA NSDP : BASE YEAR 2011-12
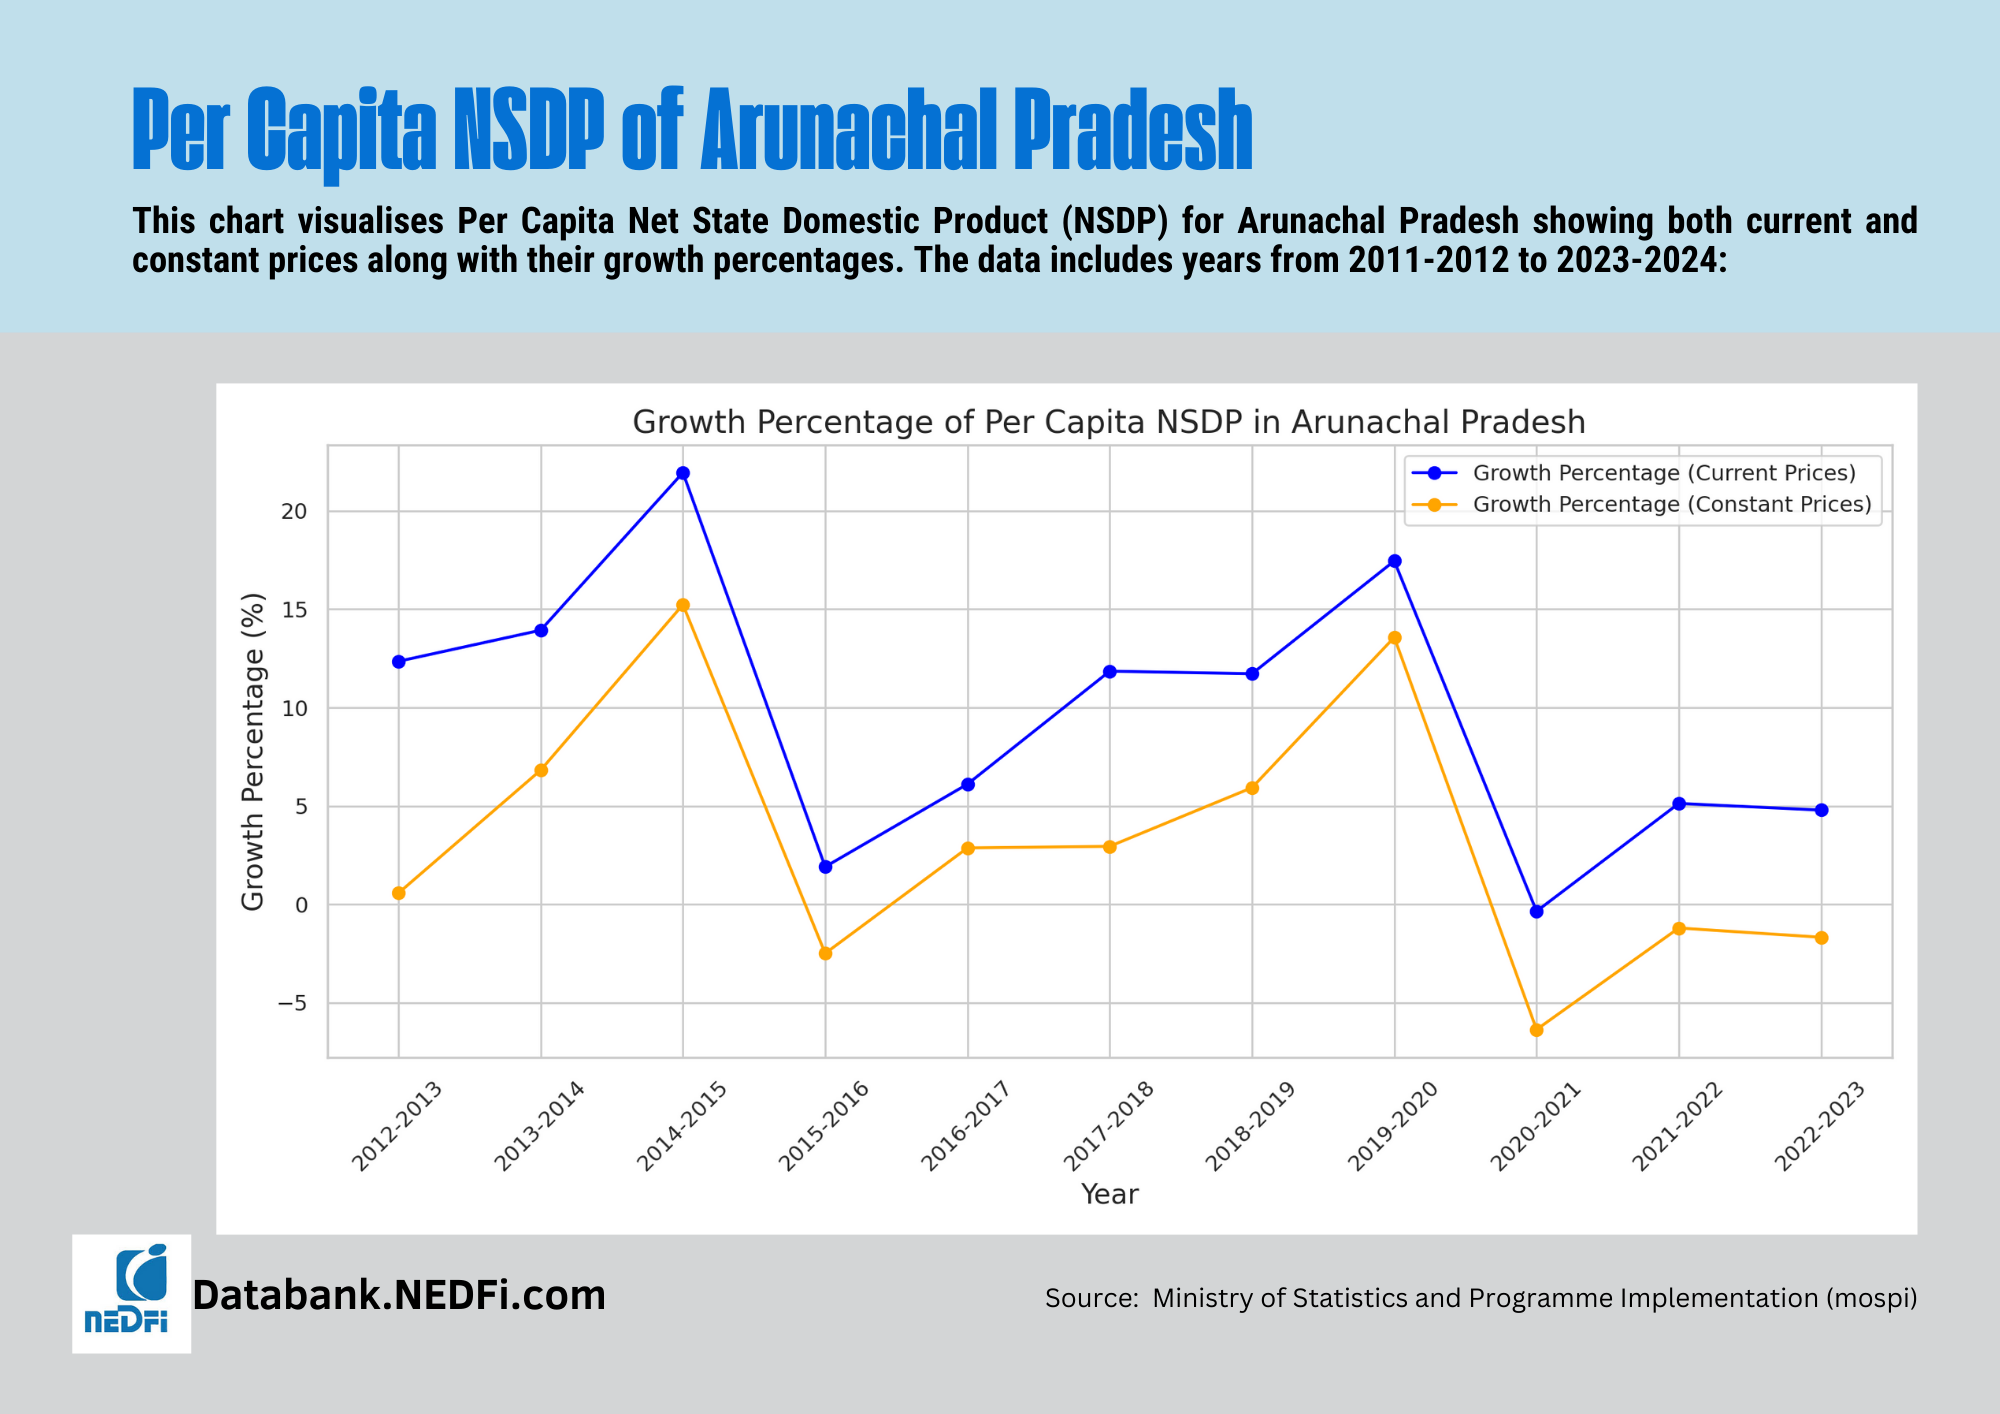
Per Capita Net State Domestic Product at Current Prices and Percentage of Growth over previous year:
(As on 01-08-2024)
| Year | PC NSDP - Current Prices (in Rupees) | % Growth over previous year |
| 2011-2012 | 73540 | - |
| 2012-2013 | 82626 | 12.35 |
| 2013-2014 | 94135 | 13.93 |
| 2014-2015 | 114789 | 21.94 |
| 2015-2016 | 116985 | 1.91 |
| 2016-2017 | 124129 | 6.11 |
| 2017-2018 | 138836 | 11.85 |
| 2018-2019 | 155103 | 11.72 |
| 2019-2020 | 182171 | 17.45 |
| 2020-2021 | 181537 | -0.35 |
| 2021-2022 | 190851 | 5.13 |
| 2022-2023 | 199992 | 4.79 |
| 2023-2024 | NA | NA |
Source: Ministry of Statistics and Programme Implementation (mospi)
Per Capita Net State Domestic Product at Constant (2011-12) Prices and Percentage of Growth over previous year:
(As on 01-08-2024)
| Year | PC NSDP - Constant Prices (in Rupees) | % Growth over previous year |
| 2011-2012 | 73540 | - |
| 2012-2013 | 73960 | 0.57 |
| 2013-2014 | 79004 | 6.82 |
| 2014-2015 | 91034 | 15.23 |
| 2015-2016 | 88768 | -2.49 |
| 2016-2017 | 91311 | 2.87 |
| 2017-2018 | 94000 | 2.95 |
| 2018-2019 | 99570 | 5.93 |
| 2019-2020 | 113081 | 13.57 |
| 2020-2021 | 105892 | -6.36 |
| 2021-2022 | 104617 | -1.20 |
| 2022-2023 | 102870 | -1.67 |
| 2023-2024 | NA | NA |
Source: Ministry of Statistics and Programme Implementation (mospi)