District-Wise Small Tea Growers of Assam Registered with Tea Board of India, 2022-23 (upto August 2023):
| District | For the year 2022-23 | Upto August 2023 | ||
| No. of Small Tea Growers | Area in Hectare | No. of Small Tea Growers | Area in Hectare | |
| Kokrajhar | 471 | 1275.48 | 471 | 1275.48 |
| Dhubri | 81 | 52.66 | 81 | 52.66 |
| Goalpara | 221 | 249.94 | 221 | 249.94 |
| Barpeta | 3 | 6 | 3 | 6 |
| Morigaon | 2 | 6.45 | 2 | 6.45 |
| Nagaon | 2234 | 3370.18 | 2234 | 3370.17 |
| Sonitpur | 3881 | 4294 | 3881 | 4294 |
| Lakhimpur | 3066 | 2295.58 | 3066 | 2295.58 |
| Dhemaji | 1744 | 1779.03 | 1855 | 1847.32 |
| Tinsukia | 23716 | 22266.84 | 24650 | 23143 |
| Dibrugarh | 27347 | 20572.52 | 28555 | 21475.16 |
| Sivasagar | 5023 | 4478.64 | 5037 | 4488.73 |
| Jorhat | 8629 | 6708.97 | 8629 | 6708.97 |
| Golaghat | 13578 | 13316.82 | 13578 | 13316.82 |
| Karbi Anglong | 2672 | 3740.77 | 2672 | 3740.77 |
| Dima Hasao | 4 | 10.47 | 4 | 10.47 |
| Cachar | 204 | 575.56 | 204 | 575.56 |
| Karimganj | 30 | 105.05 | 30 | 105.05 |
| Hailakandi | 9 | 28.68 | 9 | 28.68 |
| Bongaigaon | 594 | 492.8 | 594 | 492.8 |
| Chirang | 30 | 30.05 | 30 | 30.05 |
| Kamrup | 5 | 17.53 | 5 | 17.53 |
| Kamrup Metro | 0 | 0 | 0 | 0 |
| Nalbari | 0 | 0 | 0 | 0 |
| Baksa | 356 | 484.46 | 359 | 489.50 |
| Darrang | 34 | 40.92 | 34 | 40.92 |
| Udalguri | 7580 | 8612.40 | 7580 | 8612.40 |
| Charaideo | 10198 | 9453.08 | 10997 | 10047.4 |
| Biswanath | 10767 | 10914.84 | 10767 | 10914.83 |
| Hojai | 0 | 0 | 0 | 0 |
| Majuli | 0 | 0 | 0 | 0 |
| South Salamara | 0 | 0 | 0 | 0 |
| West Karbi Anglong | 0 | 0 | 0 | 0 |
| Assam | 122479 | 115179.27 | 125548 | 117635.76 |
Source: Statistical Handbook Assam-2023
District-Wise Tea Area of Big Tea Growers in Assam, 2022-23:
| District | Big Tea Growers Tea Area (in Hect.) |
| Kokrajhar | 1506.65 |
| Dhubri | 1187.33 |
| Goalpara | 389.32 |
| Barpeta | 0 |
| Morigaon | 425 |
| Nagaon | 7621.74 |
| Sonitpur | 17404.44 |
| Lakhimpur | 4134.18 |
| Dhemaji | 117.37 |
| Tinsukia | 35874.58 |
| Dibrugarh | 33019.9 |
| Sivasagar | 9953.34 |
| Jorhat | 20201.67 |
| Golaghat | 19996.78 |
| Karbi Anglong# | 1507.16 |
| Dima Hasao | 222.33 |
| Cachar | 20809.06 |
| Karimganj | 7799.42 |
| Hailakandi | 6884.66 |
| Bongaigaon | 383.74 |
| Chirang | 0 |
| Kamrup | 957.87 |
| Kamrup Metro | 0 |
| Nalbari | 0 |
| Baksa | 2073.84 |
| Darrang | 1217.71 |
| Udalguri | 10898.56 |
| Biswanath | 13269.38 |
| Charaideo | 14742.93 |
| Hojai | 0 |
| Majuli | 0 |
| South Salamara | 0 |
| West Karbi Anglong | 0 |
| Assam | 232598.96 |
Source: Statistical Handbook Assam-2023
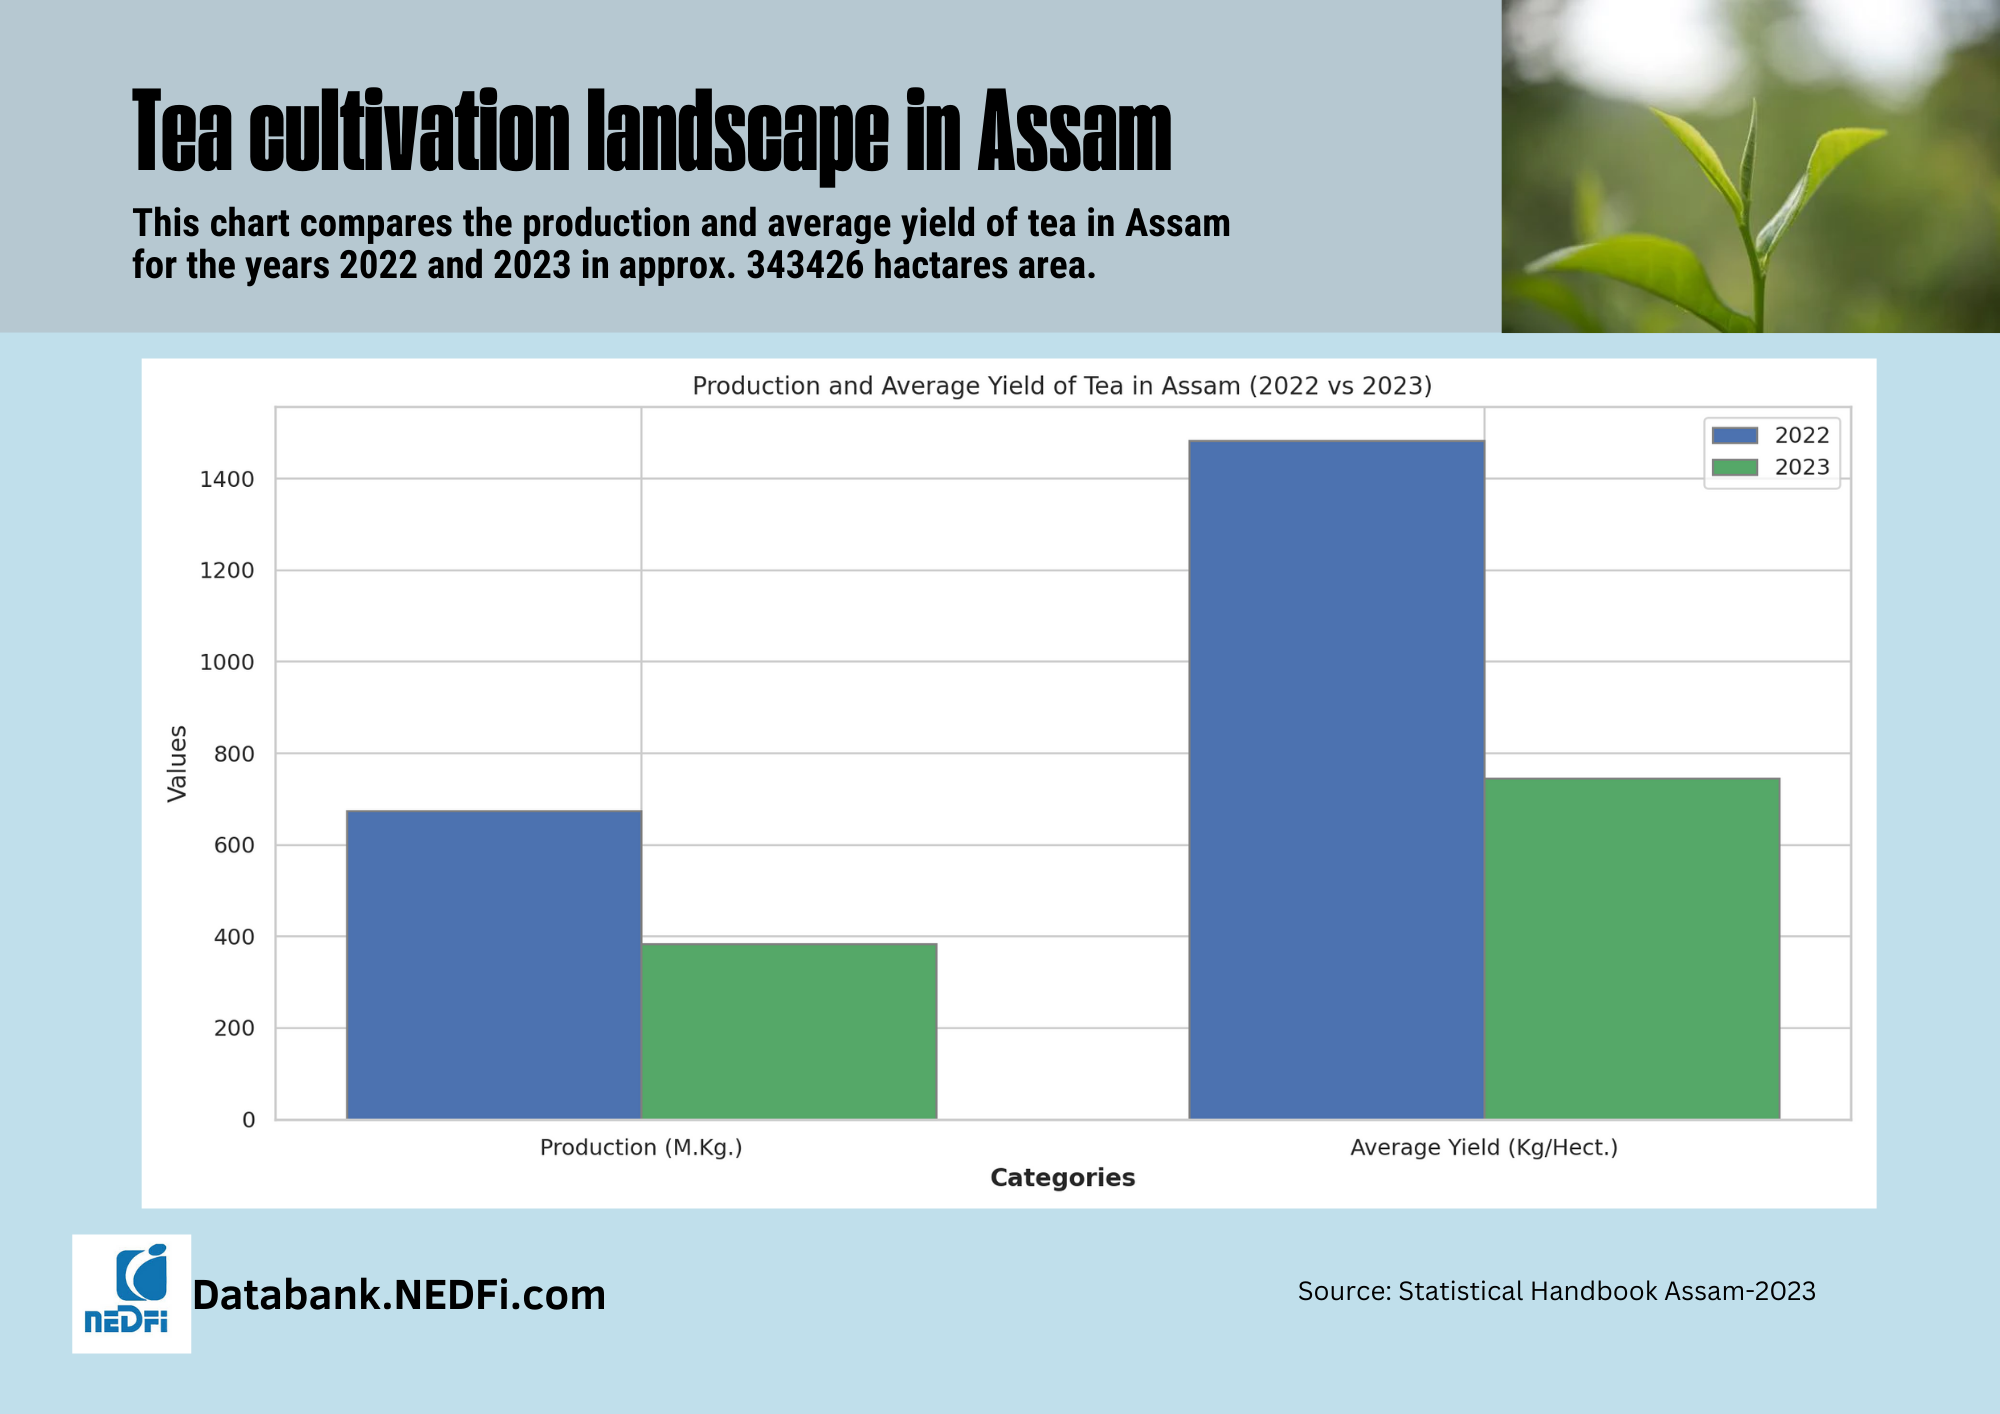
District-wise Area, Production and Average Yield of Tea in Assam as per Plantation District, 2022 and 2023:
| Plantation District | Area under Tea Cultivation (in Hect.) | Production (in M.Kg.) | Average Yield (Kg. per Hect.) | |||
| 2022 | 2023* | 2022 | 2023* | 2022 | 2023* | |
| 1 | 2 | 3 | 4 | 5 | 6 | 7 |
| Kokrajhar | 2782.13 | 2782.13 | 4.39 | 2.17 | 1578 | 712 |
| Dhubri | 1239.99 | 1239.99 | 2.68 | 1.48 | 2162 | 1194 |
| Goalpara | 639.26 | 639.26 | 1.87 | 0.83 | 2925 | 1220 |
| Barpeta | 5.53 | 5.53 | 0.00 | 0.00 | 0 | 0 |
| Morigaon | 431.45 | 431.45 | 0.96 | 0.42 | 2225 | 974 |
| Nagaon | 10991.92 | 10991.91 | 13.10 | 6.41 | 1192 | 553 |
| Sonitpur | 21698.42 | 21698.42 | 46.85 | 24.40 | 2159 | 1034 |
| Lakhimpur | 362.77 | 362.77 | 0 | 0 | 0 | 0 |
| Dhemaji | 1896.40 | 1964.69 | 0.00 | 0.71 | 0 | 356 |
| Tinsukia | 58141.42 | 59017.55 | 137.78 | 87.24 | 2370 | 1284 |
| Dibrugarh | 53592.42 | 54495.06 | 122.43 | 73.22 | 2284 | 1189 |
| Sivasagar | 14431.98 | 14442.07 | 77.22 | 45.23 | 5321 | 2795 |
| Charaideo | 24196.01 | 24790.33 | 1.57 | 2.79 | 65 | 111 |
| Jorhat | 26910.64 | 26910.64 | 61.22 | 32.91 | 2286 | 1118 |
| Golaghat | 33313.60 | 33313.60 | 71.55 | 35.33 | 2147 | 1060 |
| Karbi Anglong | 4939.27 | 4939.27 | 6.56 | 2.49 | 1328 | 494 |
| Dima Hasao | 232.80 | 232.80 | 0.02 | 0 | 86 | 0 |
| Cachar | 21384.62 | 21384.62 | 24.88 | 12.89 | 1163 | 584 |
| Karimganj | 7904.47 | 7904.47 | 5.51 | 2.90 | 697 | 355 |
| Hailakandi | 6912.44 | 6912.44 | 10.54 | 5.36 | 1525 | 746 |
| Bongaigaon | 876.58 | 876.58 | 1.62 | 0.97 | 1848 | 1061 |
| Chirang | 30.05 | 30.05 | 0.00 | 0.00 | 0 | 0 |
| Kamrup | 975.40 | 975.40 | 1.36 | 0.70 | 1394 | 636 |
| Kamrup Metro | 0 | 0 | 2.12 | 1.08 | 0 | 0 |
| Nalbari | 0 | 0 | 0 | 0 | 0 | 0 |
| Baksa | 2558.30 | 2563.34 | 3.51 | 1.84 | 1372 | 687 |
| Darrang | 1258.63 | 1258.63 | 2.49 | 1.29 | 1978 | 930 |
| Udalguri | 19510.96 | 19510.96 | 35.77 | 21.47 | 1833 | 1026 |
| Biswanath | 24184.22 | 24184.21 | 38.42 | 19.71 | 1589 | 730 |
| Hojai | 0 | 0 | 0 | 0 | 0 | 0 |
| Majuli | 0 | 0 | 0 | 0 | 0 | 0 |
| South Salamara | 0 | 0 | 0 | 0 | 0 | 0 |
| West Karbi Anglong | 0 | 0 | 0 | 0 | 0 | 0 |
| Assam | 341401.68 | 343858.17 | 674.72 | 383.84 | 41527 | 20849 |
* upto August 2023
Source: Statistical Handbook Assam-2023
Number of Tea Gardens, Area and Production of Tea according to size of the Gardens in Assam, 2022 to 2023:
| Year | Small Tea Growers (upto 10.12 hect.) | Big Tea Growers (above 10.12 hect.) | Total | ||||||
| No. of Gardens | Area (in Ha) | Production (M. Kg.) | No. of Gardens | Area (in Ha) | Production (M. Kg.) | No. of Gardens | Area (in Ha) | Production (M. Kg.) | |
| 2022 | 122479 | 115179 | 328.99 | 762 | 232962 | 359.71 | 123241 | 348141 | 688.70 |
| 2023# | 125548 | 117636 | 189.82 | 762 | 232962 | 202.09 | 126310 | 350598 | 391.91 |
# upto August 2023.
Source: Statistical Handbook Assam-2023
Month-wise Sale and Price of Tea at Guwahati Tea Auction Centre, 2022 and 2023:
| Month | Sale (Million Kg.) | Price (Rs. per Kg.) | ||
| 2022 | 2023 | 2022 | 2023 | |
| January | 11.47 | 12.91 | 151.19 | 144.01 |
| February | 3.39 | 2.16 | 140.93 | 140.42 |
| March | 1.15 | 1.25 | 129.14 | 142.71 |
| April | 2.88 | 3.73 | 236.24 | 210.86 |
| May | 9.84 | 9.23 | 184.26 | 194.00 |
| June | 11.48 | 12.11 | 212.49 | 215.07 |
| July | 14.45 | 12.62 | 211.35 | 212.81 |
| August | 17.76 | 11.74* | 214.83 | 201.95* |
| September | 16.68 | - | 200.80 | - |
| October | 13.93 | - | 201.27 | - |
| November | 19.01 | - | 188.68 | - |
| December | 20.53 | - | 166.79 | - |
| Total (Auction Centre) | 142.57 | 65.75 | 191.67 | 191.31 |
| Private Sale | 18.82 | 7.29** | 199.40 | 165.78** |
| Grand Total | 161.39 | 73.04 | 192.57 | 188.76 |
* August, 2023 figure is upto 17-08-2023; ** Private sale 2023 figures is upto July 2023.
The figures of August comes in the month of Sept.
Source: Statistical Handbook Assam-2023
Quantity and average price of Tea sold in Guwahati Tea Auction Centre, 2022 AND 2023:
| Type/ Centre | 2022 | 2023 | ||
| Quantity (Million Kg.) | Average Price (Rs. per Kg.) | Quantity (Million Kg.) | Average Price (Rs. per Kg.) | |
| (A) LEAF | ||||
| (a) C.T.C. | ||||
| Assam | 90.27 | 191.18 | 42.08 | 193.32 |
| Cachar | 5.68 | 164.87 | 2.56 | 159.89 |
| Arunachal | 1.97 | 220.79 | 0.85 | 217.24 |
| Meghalaya | 0.10 | 135.66 | 0.01 | 139.11 |
| Nagaland | 1.09 | 229.43 | 0.52 | 251.82 |
| Tripura | 1.47 | 138.76 | 0.49 | 133.84 |
| Total : CTC. | 100.58 | 189.87 | 46.51 | 191.93 |
| (b) Orthodox | ||||
| Assam | 2.780 | 266.98 | 1.18 | 215.33 |
| Cachar | - | 2802.00 | - | - |
| Tripura | - | - | - | - |
| Meghalaya | 0.003 | 319.65 | 0.0002 | 212.42 |
| Arunachal | 0.001 | 304.16 | 0.00 | 252.45 |
| Green Tea | 0.017 | 341.82 | 0.025 | 272.30 |
| Total( Orthodox) | 2.800 | 267.51 | 1.20 | 216.60 |
| Total : Leaf Tea | 103.4 | 191.97 | 47.71 | 192.59 |
| (B) DUST | ||||
| (a) C.T.C. | ||||
| Assam | 36.81 | 191.80 | 16.89 | 188.89 |
| Cachar | 0.83 | 146.76 | 0.380 | 146.49 |
| Arunachal | 0.76 | 197.10 | 0.35 | 185.13 |
| Meghalaya | 0.03 | 138.10 | 0.011 | 143.76 |
| Nagaland | 0.48 | 233.54 | 0.25 | 234.37 |
| Tripura | 0.19 | 132.04 | 0.072 | 131.60 |
| Total : CTC. | 39.10 | 191.13 | 17.95 | 188.30 |
| (b) Orthodox | ||||
| Assam | 0.11 | 105.46 | 0.05 | 100.46 |
| Cachar | - | - | - | - |
| Tripura | - | - | - | - |
| Meghalaya | 0.00013 | 90.71 | 0.0034 | 91.00 |
| Arunachal | 0 | 99 | - | - |
| Green Tea | - | - | - | - |
| Total( Orthodox) | 0.11092 | 105.3956 | 0.05034 | 100.3900 |
| Total : Dust Tea | 39.210 | 190.885 | 18.0033 | 188.00 |
| All Teas ( A+B) | 142.593 | 191.67 | 65.7133 | 191.3468 |
Source: Statistical Handbook Assam 2023
Tea statistics of Assam, 2001 to 2021:
| Year | No. of Tea Gardens | Area under Tea (in '000 Hectare) | Total Tea Production (in 000 Kg.) | Average yield (Kg/Hectare.) |
| 2001 | 40795 | 269 | 453587 | 1685 |
| 2002 | 43272 | 271 | 433327 | 1601 |
| 2003 | 43293 | 272 | 434759 | 1601 |
| 2004 | 43293 | 272 | 435649 | 1603 |
| 2005 | 49102 | 301 | 487487 | 1622 |
| 2006 | NA | 312 | 502041 | 1610 |
| 2007 | 825 | 321.3 | 511885 | 1593 |
| 2008 | 760 | 321.4 | 487497 | 1517 |
| 2009 | 760 | 321.7 | 499997 | 1554 |
| 2010 | 760 | 322 | 480286 | 1492 |
| 2011 | 765 | 322 | 589110 | 1830 |
| 2012 | 78856 | 322 | 590120 | 1833 |
| 2013 | 69220 | 322 | 629050 | 1953 |
| 2014 | 77710 | 304 | 610970 | 2010 |
| 2015 | 83566 | 316 | 526185 | 1665 |
| 2016 | 85344 | 311 | 659740 | 2121 |
| 2017 | 88442 | 314 | 665330 | 2119 |
| 2018 | 101850 | 338 | 691910 | 2047 |
| 2019 | 108136 | 337 | 716490 | 2126 |
| 2020 | 122440 | 347 | 618200 | 1781 |
| 2021 (Jan-Aug)* | 122440 | 347 | 379790 | 1094 |
Source: Economic Survey of Assam 2013-14, 2015-16, 2016-17 and 2021-22