NSDP : BASE YEAR 2011-12
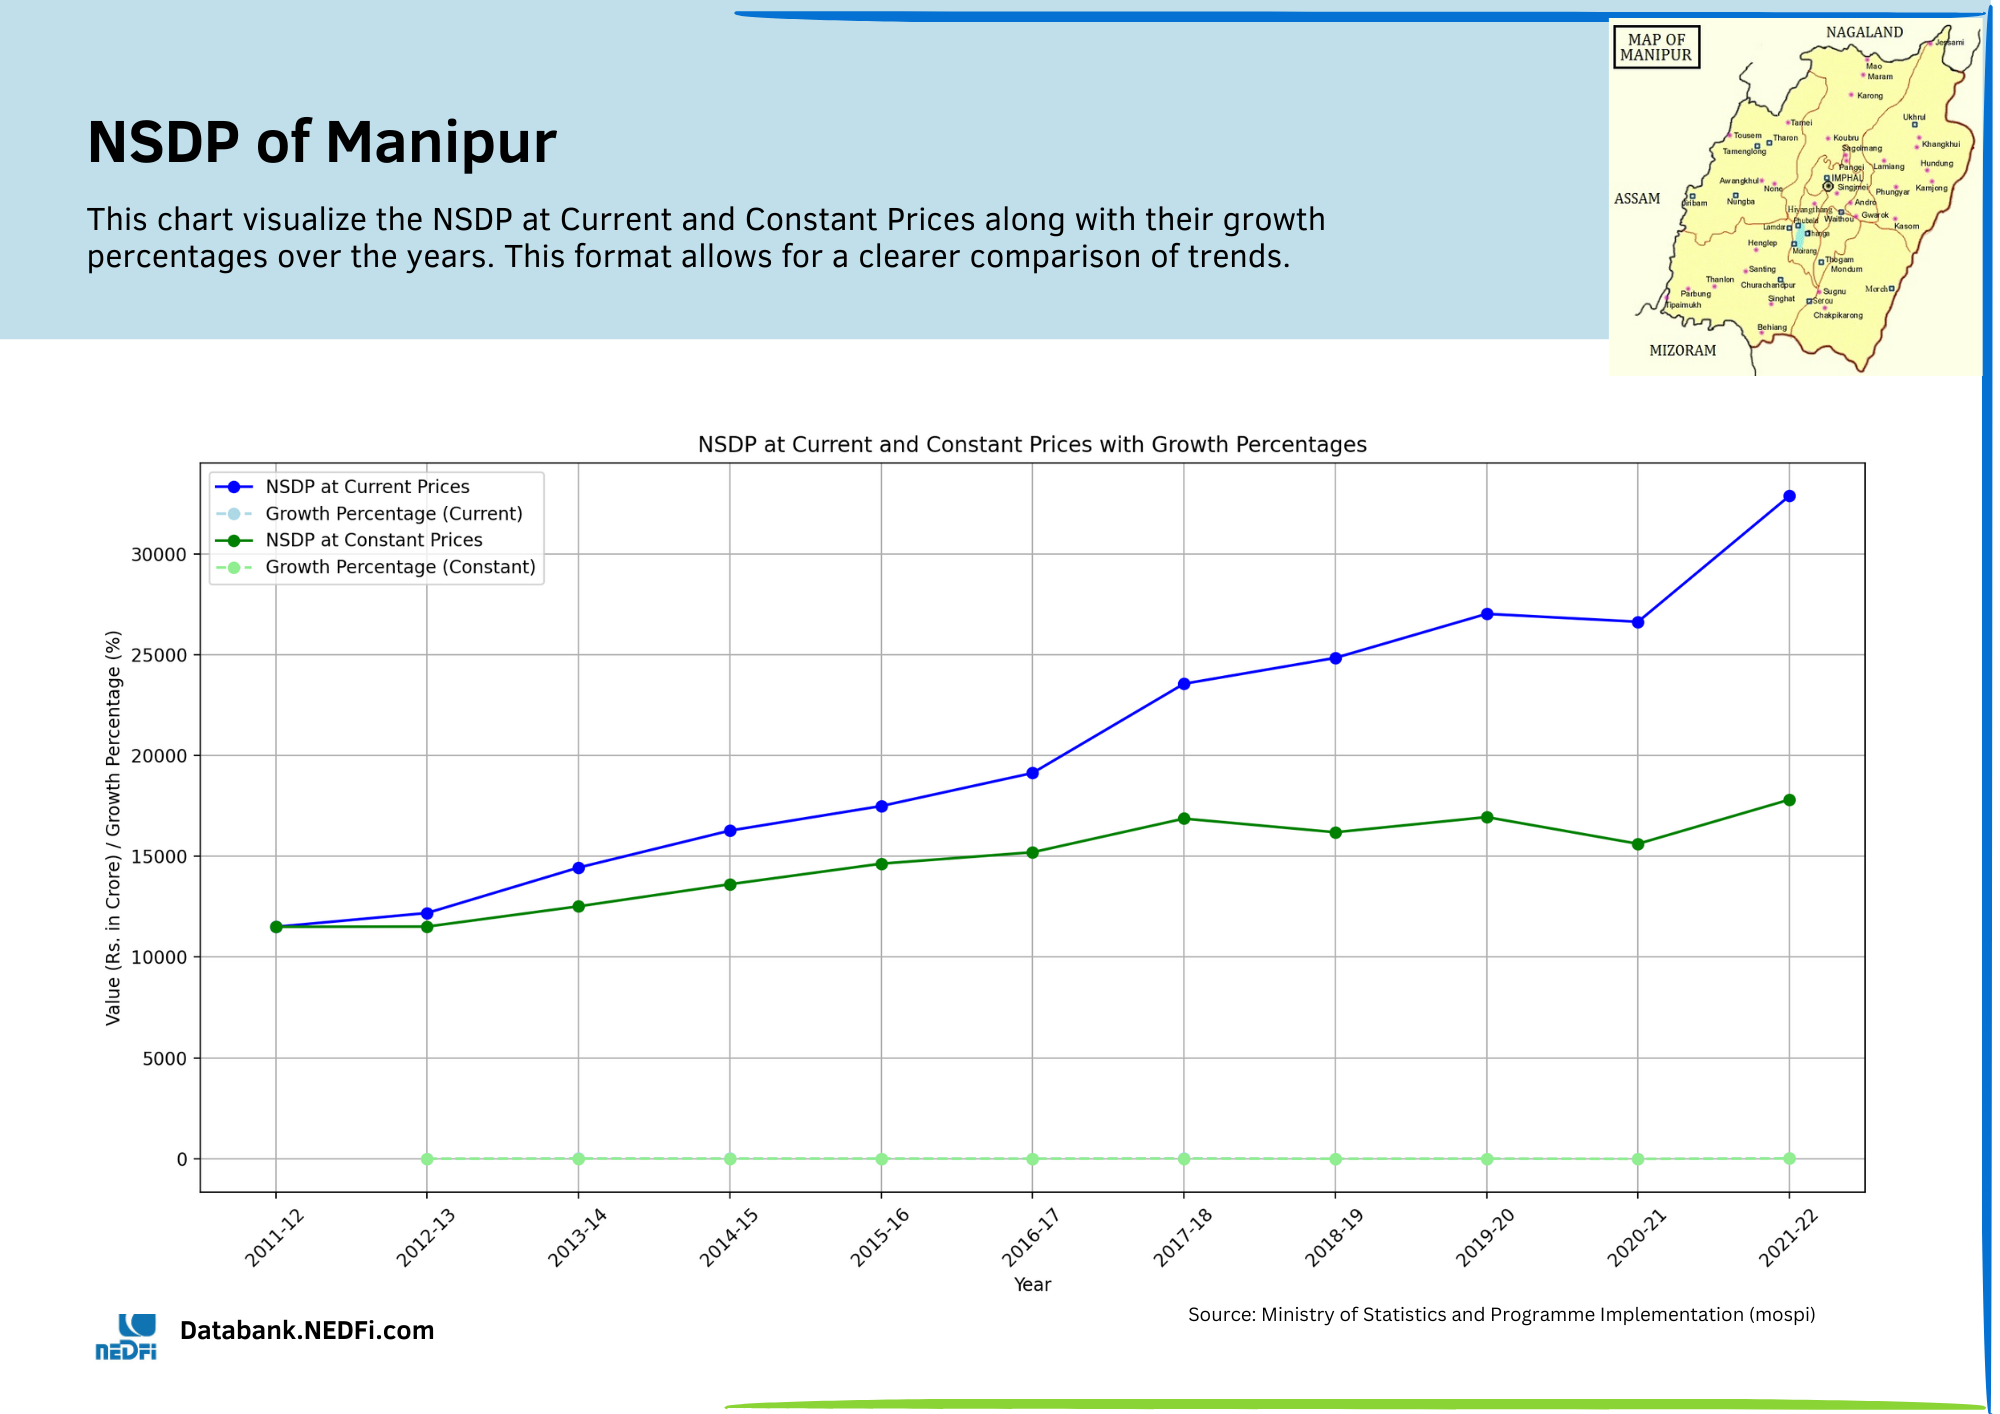
Net State Domestic Product (NSDP) at Current Prices and Percentage of Growth over previous year of Manipur: (As on 01-08-2024)
| Year | NSDP - Current Prices (Rs. in Crore) | % Growth over previous year |
| 2011-2012 | 11501 | - |
| 2012-2013 | 12188 | 5.97 |
| 2013-2014 | 14440 | 18.47 |
| 2014-2015 | 16275 | 12.71 |
| 2015-2016 | 17493 | 7.48 |
| 2016-2017 | 19132 | 9.37 |
| 2017-2018 | 23557 | 23.13 |
| 2018-2019 | 24840 | 5.45 |
| 2019-2020 | 27025 | 8.8 |
| 2020-2021 | 26632 | -1.45 |
| 2021-2022 | 31417 | 17.97 |
| 2022-2023 | 35894 | 14.25 |
| 2023-2024 | NA | NA |
Source: Ministry of Statistics and Programme Implementation (mospi)
Net State Domestic Product (NSDP) at Constant (2011-12) Prices and Percentage of Growth over previous year of Manipur: (As on 01-08-2024)
| Year | NSDP - Constant Prices (Rs. in Crore) | % Growth over previous year |
| 2011-2012 | 11501 | - |
| 2012-2013 | 11515 | 0.12 |
| 2013-2014 | 12519 | 8.72 |
| 2014-2015 | 13615 | 8.75 |
| 2015-2016 | 14635 | 7.49 |
| 2016-2017 | 15201 | 3.87 |
| 2017-2018 | 16870 | 10.98 |
| 2018-2019 | 16193 | -4.02 |
| 2019-2020 | 16945 | 4.64 |
| 2020-2021 | 15620 | -7.82 |
| 2021-2022 | 17353 | 11.09 |
| 2022-2023 | 19319 | 11.33 |
| 2023-2024 | NA | NA |
Source: Ministry of Statistics and Programme Implementation (mospi).
![]() Net State Domestic Product (NSDP) at Current and Constant (2004-2005) Prices:
Net State Domestic Product (NSDP) at Current and Constant (2004-2005) Prices: ![]()
![]() Net State Domestic Product (NSDP) at Current and Constant (1999-2000) Prices:
Net State Domestic Product (NSDP) at Current and Constant (1999-2000) Prices: ![]()
![]() Net State Domestic Product (NSDP) at Current and Constant (1993-1994) Prices:
Net State Domestic Product (NSDP) at Current and Constant (1993-1994) Prices: ![]()
![]() Net State Domestic Product (NSDP) at Current and Constant (1980-1981) Prices:
Net State Domestic Product (NSDP) at Current and Constant (1980-1981) Prices: ![]()