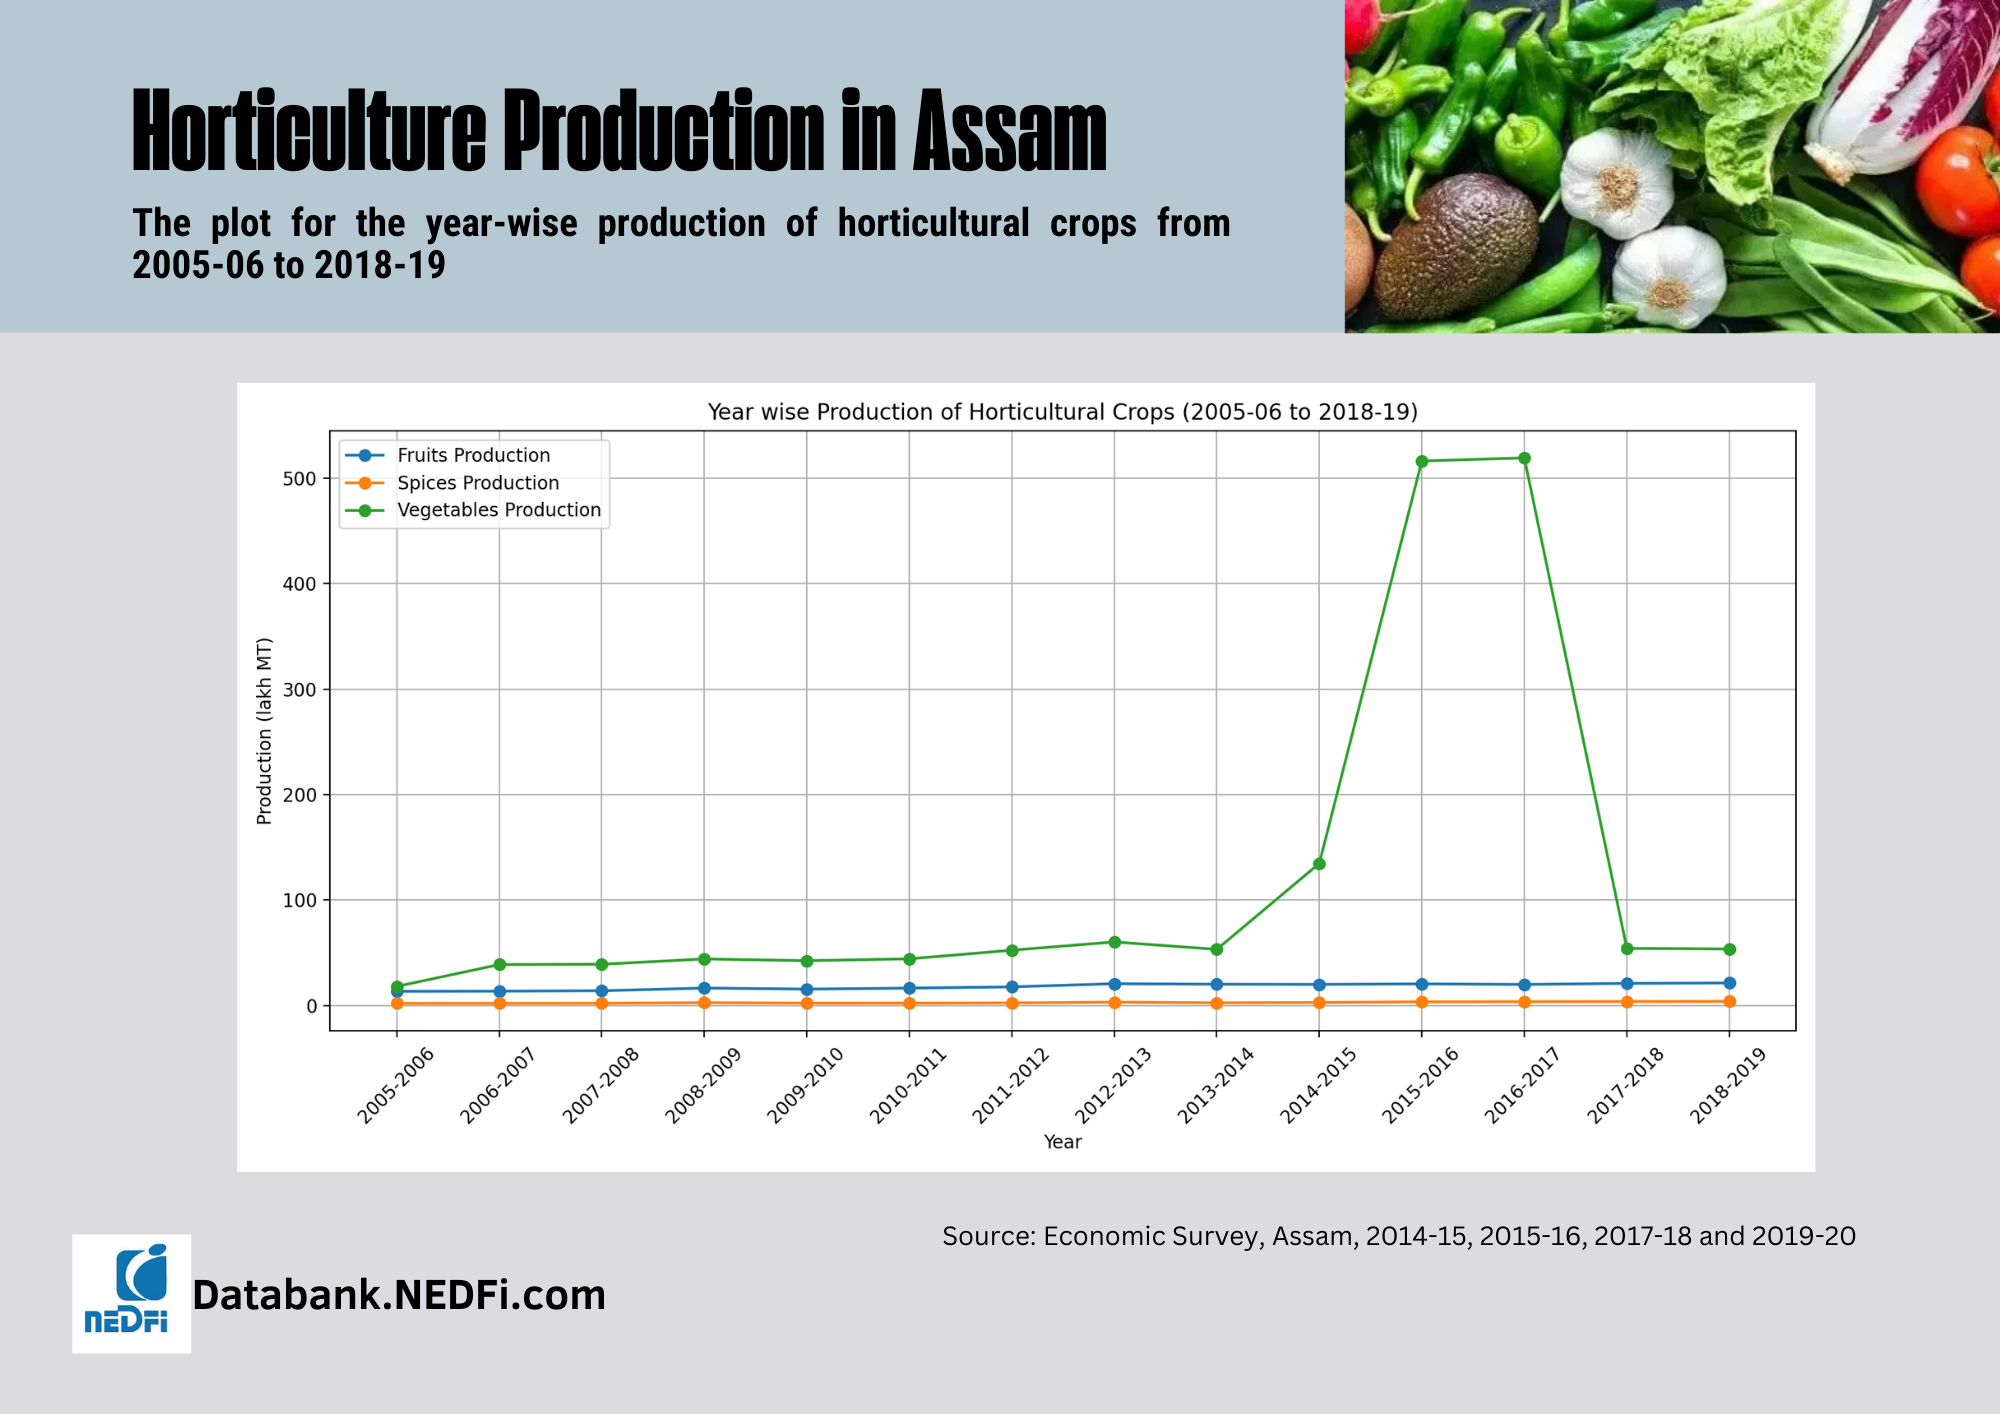
Year wise Area, Production & Productivity of Horticultural Crops, 2005-06 to 2018-19:
| Year | Fruits | Spices | Vegetables | ||||||
| Area (lakh hectares) | Production (lakh MT | Productivity (Kg./hect.) | Area (lakh hectares) | Production (lakh MT | Productivity (Kg./hect.) | Area (lakh hectares) | Production (lakh MT | Productivity (Kg./hect.) | |
| 2005-2006 | 1.13 | 13.52 | 12005 | 0.86 | 2.12 | 2475 | 2.32 | 18.18 | 16485 |
| 2006-2007 | 1.14 | 13.72 | 12139 | 0.86 | 2.14 | 2476 | 2.36 | 38.87 | 16469 |
| 2007-2008 | 1.16 | 14.08 | 14142 | 0.88 | 2.18 | 2478 | 2.38 | 39.18 | 16462 |
| 2008-2009 | 1.34 | 16.61 | 12425 | 0.93 | 2.80 | 3023 | 2.46 | 44.20 | 17923 |
| 2009-2010 | 1.27 | 15.65 | 12370 | 0.94 | 2.35 | 2505 | 2.51 | 42.55 | 16952 |
| 2010-2011 | 1.37 | 16.56 | 12485 | 1.01 | 2.30 | 2277 | 2.57 | 44.33 | 17231 |
| 2011-2012 | 1.38 | 17.75 | 12885 | 1.04 | 2.56 | 2464 | 3.66 | 52.51 | 24325 |
| 2012-2013 | 1.51 | 20.74 | 13760 | 1.10 | 3.28 | 2970 | 3.86 | 60.34 | 27536 |
| 2013-2014 | 1.42 | 20.25 | 14219 | 1.04 | 2.67 | 2578 | 3.65 | 53.30 | 24797 |
| 2014-2015 | 1.44 | 20.12 | 13869 | 1.08 | 2.97 | 2749 | 3.91 | 134.78 | 25455 |
| 2015-2016 | 1.44 | 20.56 | - | 1.09 | 3.58 | - | 2.80 | 516.32 | - |
| 2016-2017 | 1.41 | 20.06 | 14144 | 1.11 | 3.77 | 3380 | 2.80 | 519.23 | 18485 |
| 2017-2018 | 1.46 | 21.04 | 14390 | 1.12 | 3.89 | 3458 | 2.87 | 54.24 | 18914 |
| 2018-2019 | 1.16 | 21.47 | 14729 | 1.11 | 3.96 | 3575 | 2.88 | 53.67 | 18626 |
Total may not be equal due to rounding off to nearest zero
Source: Economic Survey, Assam, 2014-15, 2015-16, 2017-18 and 2019-20
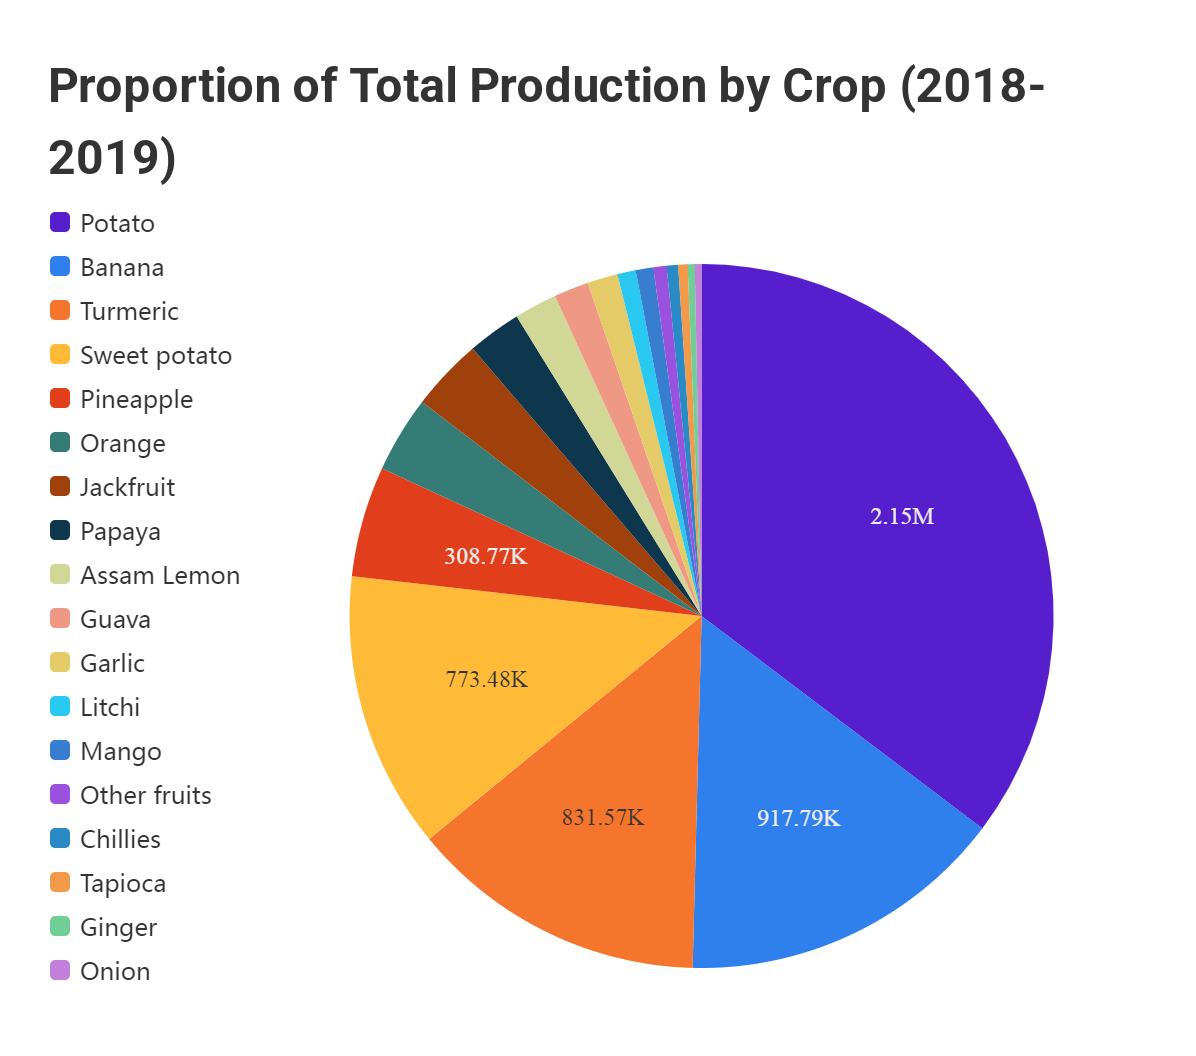
Crop wise Area, Production and Average Yield of some Major Horticultural Crops, 2017-18 and 2018-19:
(Area in Hectare, Production in MT and Yield in Kg/Hectare)
| Name of Crops | 2017-2018 | 2018-2019 | ||||
| Area | Production. | Average Yield | Area | Production. | Average Yield | |
| Banana | 53082 | 913272 | 17205 | 51113 | 917792 | 17956 |
| Pineapple | 16304 | 296524 | 18187 | 16905 | 308769 | 18265 |
| Orange | 14952 | 203716 | 13625 | 14971 | 213809 | 14281 |
| Papaya | 7212 | 147395 | 20438 | 7359 | 149866 | 20365 |
| Assam Lemon | 13302 | 112402 | 8450 | 13802 | 119318 | 8645 |
| Guava | 4427 | 96690 | 21840 | 4450 | 97254 | 21855 |
| Litchi | 5567 | 50242 | 9025 | 5617 | 51283 | 9129 |
| Jackfruit | 22145 | 199194 | 8995 | 22202 | 202482 | 9119 |
| Mango | 4682 | 48435 | 10345 | 4695 | 49133 | 10465 |
| Other fruits | 4532 | 36006 | 7945 | 4625 | 36838 | 9880 |
| Total Fruits | 146205 | 2103876 | 14390 | 145739 | 2146544 | 14729 |
| Potato | 102868 | 720968 | 7009 | 103205 | 773481 | 7495 |
| Sweet potato | 5303 | 29199 | 5506 | 5020 | 26342 | 5247 |
| Tapioca | 3117 | 28868 | 9260 | 3364 | 31751 | 9438 |
| Total Tuber Crops | 111288 | 779035 | 7000 | 111589 | 831574 | 7452 |
| Chillies | 20242 | 18994 | 938 | 19847 | 18984 | 956 |
| Turmeric | 16871 | 20787 | 1232 | 15896 | 19395 | 1220 |
| Onion | 8338 | 80374 | 9639 | 8211 | 84835 | 10332 |
| Ginger | 18105 | 161604 | 8926 | 17865 | 166272 | 9307 |
| Garlic | 10450 | 62334 | 5965 | 10450 | 62334 | 5965 |
| Coriander | 29749 | 30790 | 1035 | 29799 | 30122 | 1011 |
| Black Pepper | 3458 | 7622 | 2204 | 3388 | 7476 | 2207 |
| Other spices | 5186 | 6145 | 1185 | 5186 | 6145 | 1185 |
| Total Spices | 112399 | 388650 | 3458 | 110642 | 395563 | 3575 |
| Kharif. vegetables | 87367 | 1644424 | 18822 | 87740 | 16000932 | 18246 |
| Rabi. vegetables | 199387 | 3779106 | 18954 | 200380 | 3765609 | 18792 |
| Total Vegetables | 286754 | 5423530 | 18914 | 288120 | 5366541 | 18626 |
Source: Economic Survey Assam 2019-20